Download
1 / 10
100 likes | 202 Views
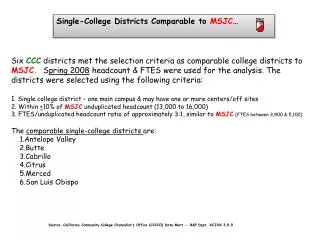
MSJC Growth Transfers to UC & CSU College Going Rates MSJC Enrollment. % chg vs. 10 yrs ago. % chg vs. yr ago. CAGR for past 10 yrs. Local CCC’s Headcount AY2007-’08. Source: California Community College Chancellor’s Office Data Mart R&P Dept. XCJH 8.15.08. MSJC Transfers to CSU & UC

E N D
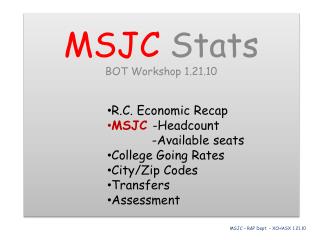
MSJCGrowthTransfers to UC & CSUCollege Going RatesMSJCEnrollment
% chg vs. 10 yrs ago % chg vs. yr ago CAGR for past 10 yrs Local CCC’s Headcount AY2007-’08 Source: California Community College Chancellor’s Office Data Mart R&P Dept. XCJH 8.15.08
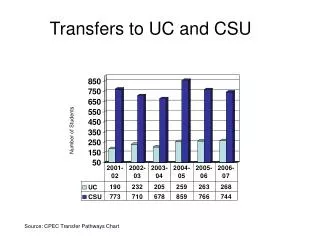
MSJCTransfers to CSU & UC 2007-’08 AY 07-’08 % Chg. vs. Yr. + 22% + 9% + 26% MSJC over 480 students transferred to CSU & UC, up 22% vs. prior yr. Source: Ca. Gov -Postsecondary Education Commission - CPEC Transfer Pathways Charts- CPEC.CA.GOV –MSJC R&P Dept. XCH11.13.08
2007 California College-Going Rates*by County Riverside County’s California College-Going Rate 38% is significantly below the California state average of 48%. * Public High Schools Source: California Postsecondary Education Commission - MSJC R&PD 12/4/8
2007 California College-Going Rateby Unified School District 7 of 8 MSJC feeder H.S. Districts are below state average. * State % includes public H.S. only; districts includes public & private Source: California Postsecondary Education Commission - MSJC R&PD 12/4/8
MSJC Fall 2008 Unduplicated Enrollmentsby feeder districts MSJC Feeder H.S. Districts account for over 40% of the student body. Source: MSJC MIS DataTel XSG MSJC R&PD 12/4/8
MSJC Fall 2008 Unduplicated Enrollmentsby feeder districts MSJC Feeder H.S. Districts account for over 40% of the student body. Source: MSJC MIS DataTel XSG MSJC R&PD 12/4/8
2007 California College-Going Rate*by Institution Type Riverside County College-Going rate is below state average for all institutional types * Public High Schools Source: California Postsecondary Education Commission - MSJC R&PD 02/26/08
MSJCTransfers to CSU & UC by AY AY 07-’08 % Chg. vs. Yr. CSU + 26% UC + 9% For the AY 07-’08 MSJC over 480 students transferred to CSU & UC, up 22% vs. prior year. Total + 22% Source: Ca. Gov -Postsecondary Education Commission - CPEC Transfer Pathways Charts- CPEC.CA.GOV –MSJC R&P Dept. XCH11.13.08