Download
1 / 27
270 likes | 426 Views
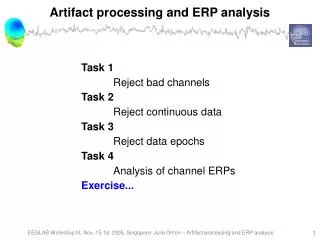
Artifact cancellation and nonparametric spectral analysis . Outline. Artifact processing Artifact cancellation Nonparametric spectral analysis. Introduction. Artifact processing Rejection cancellation Rejection main alternative one would hope to retain data Cancellation requirements

E N D
Outline • Artifact processing • Artifact cancellation • Nonparametric spectral analysis
Introduction • Artifact processing • Rejectioncancellation • Rejection main alternative • one would hope to retain data • Cancellation requirements • clinical information • no new artifacts • spike detectors • Additive/multiplicative model • Artifact reduction using linear filtering
Artifact cancellation • Using linearly combined reference signals • Adaptive artfact cancellation using linearly combined reference signals • Using filtered reference signals
Linearly combined reference signals • Eye movements & blinks • several referene signals • positioning • additive model • EOG linearly trasferred to EEG • weights
In detail • Uncorrelated • Mean square error • Minimization, differentation • Spatial correlation, cross correlation • fixed over time • zero gradient • Estimation • blinks, eye-movements at onset
In detail 2 • Number of reference signals • Only EOG cancelled • ECG • Rejection used a lot (in MEG) • expect when lots of blinks (ssp)
Adaptive version • Time-varying changes • Tracking of slow changes • Adaptive algorithm • LMS • weight(s) function of time • optimal solution changes with time • method of steepest descent • negative error gradient vector
In detail • Parameter selection • time • noise • Expectation • instantaneous value • zero setting • performance estimation • fluctuation of weights
Filtered reference signals • EOG potentials exhibit frequency dependence • in trasfer to EEG sensor through tissue • blinks and eye movements • Improved cancellation with transfer function replacement • spatial and temporal information • v0 estimation • FIR (lengths)
Details • Stationary processes • Second order characterisrics • Correlation information fixed
Details 2 • No a priori information • can be implemented, modified error • Also adaptive version exists • a priori impulse responses calculated at calibration
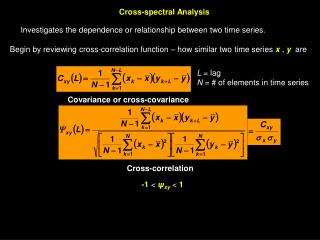
Nonparametric spectral analysis • Richer characterization of background activity that with 1D histograms • EEG rhythms • Correlate signals with sines and cosines • When? • Gaussian stationary signals • Stationary estimatation • Normal spontaneous waking activity
Nonparametric 2 • Fourier-based power spectrum analysis • no modeling assumptions • Spectral parameters • interpretation
Fourier-based power spectrum analysis • Power spectrum characterized by correlation function (stationary) • If ergodic, approximate with time average estimator (negative lags) • combination called periodogram • equals squared magnitude of DFT
Fourier considerations • Periodogram biased • window dependent (convolution) • smearing (main lobe) • leakage (side lobes) • synchronized rhythm better described by power in frequency band • variance periogoram • does not approach zero with sample increase • consistency
Periodogram • Windowing and averaging • leakage & periodogram variance reduction • Windows • from rectangular to smaller sidelobes • wider main lobe, spectral resolution • Variance reduction • nonoverlapping segments, averaging • resolution decrease, trade-off • combinations, degree of overlap
Spectral parametrs • Resulting power spectrum often not readilty interpreted • Condensed into compact set of parameters • feature extraction • parameters describing prominent features of the spectrum • peaks, frequencies • general usage
Spectral choices • Visual inspection • format selection • assessing represantiveness • Scaling • scope of the analysis
Parameters • Power in frequency bands • Peak frequency • Spectral slope • Hjort descriptors • Spectral purity index
Power in frequency bands • Fixed/statistical bands • alpha, beta, theta etc. • from data • Ratio of, absolute power • comparison, nonphysiological factors
Peak frequency • Frequency, amplitude, width • ad hoc methods for determining peaks • more than just maximum • median, mean
Spectral slope • EEG activity made of 2 component • rhythmic, unstructured • Based on decay of high frequency components • one parameters approximation • least squares error • Quantifcation of EEG • Preconditioning of power estimate
Hjort descriptors • Spectral moments • H0 (activity) • H1 (mobility) • H2 (complexity) • Signal power, dominant frequency, bandwidth • Effectively in time domain • Clinically useful
Spectral purity index (SPI) • Heuristic • Reflects signal bandwidth (H2) • How well signal is described by a single frequency • noise susceptibility
Summary • Artifact cancellation • reference signals • linear combinations, filtering • adaptive version(s) • Spectral parameters • nonparametric • no modelling • parametric • interpretation