Download
1 / 49
490 likes | 660 Views
Nutrient Reduction in Manure through Livestock Nutritional Management. Balancing Animal Performance and Manure Management. Manure Management. N and P are the two nutrients of greatest concern when dealing with manure. N and P can be managed and utilized as fertilizer for crop production.

E N D
Nutrient Reduction in Manure through Livestock Nutritional Management
Manure Management • N and P are the two nutrients of greatest concern when dealing with manure. • N and P can be managed and utilized as fertilizer for crop production.
Nutrient Management • Nitrogen • Protein • UIP • DIP • NPN • Amino acids • Phosphorus • grains -- high • forages -- low • dicalcium phosphate
Yearly excretion estimates of various nutrients by 1400 lb Holstein cows Fraction Total for year Milk 21750 lbs DMI 14462 lbs Raw manure (feces & urine) 47475 lbs Total N (low NRC) 223 lbs Total N (high NRC) 260 lbs P (.40% P RDM) 40 lbs P (.45% P RDM) 46 lbs P (.60% P RDM) 69 lbs K (.8% K RDM) 88 lbs K (1.2% K RDM) 146 lbs Similar trends Ca, Mg, Na, Cl UIP and DIP minimums met NRC 1989
Composition of Fresh Manure N: 9.4 lb actual N/ton wet manure P: 1.9 lb actual P/ton wet manure K: 3.7 lb actual K/ton wet manure Total solids 12.8% • Composition will change with scraping and loading moisture content and volatilization of N
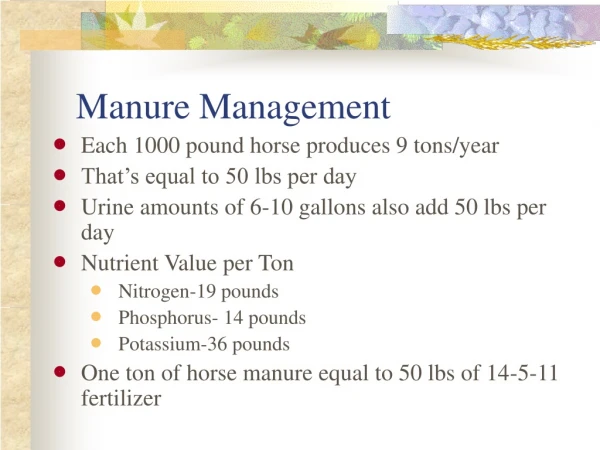
MWPS - 18 1,000 lb Market Animal 60 lb/day manure .34 lb/day N (154 g) .11 lb/day P (50 g)
Nitrogen Losses • 100% Nitrogen Excreted • 50 to 60% Volatilization • 15 to 20% Runoff, soil • 20 to 30% Removed
Nitrogen Losses 154 g N/d x .25 = 38.5g N/hd/d removed from pens
Predictable Equations • P and N excretions by cows vary • P or N intake • Factors • P or N intake • Dry Matter Intake (DMI) • Milk yield Morse et al.
NRC 1996: Phosphorus • Maintenance (Pm) Requirement 16 mg P/kg BW • Retained (Pg) Phosphorus 3.9 g/100 g protein gain
NRC 1984: Phosphorus • .028 (Wkg) + .039 protein gain (g/d) • Maintenance Requirement Reduced • 43% (1984 1996)
P Requirements Animal (lbs)Daily P requirement (gms) 150 7.7 300 11.4 900 20.9 1400 (dry) 18.2 1400 (late dry) 25.4 1400 (35 lbs milk) 46.7 1400 (70 lbs milk) 75.3 1400 (100 lbs milk) 100
Dairy NRC recommendations • .35% P RDM is enough for optimum performance • Levels of .6% or higher not uncommon
1996 NRC Phosphorus RequirementsTypical Yearling (800 lb) 0.22% of diet DM or 22.6 g/d P Intake
Typical Feedlot Diets .30 to .35% P on diet DM
Practical Considerations • Corn-based diets will run .25 to .35% P • The need for supplemental P is low
Steer Performance as Influenced by P %P P Intake,g/d ADG, lb/d DMI, lb/d Feed/Gain 0.14 15.9 3.87 25.0 6.49 0.19 19.7 3.57 22.8 6.37 0.24 27.6 3.77 25.2 6.71 0.29 32.1 3.85 24.4 6.33 0.34 36.4 3.38 23.6 7.04 SE .74 .20 .73 Erickson et al, 1998; Nebraska
Phase Feeding • Opportunities to lower N and P intakes during the latter stages of the finishing period. Consequently, this will lower N and P output • Allows nutritionists to more effectively optimize performance w/o overfeeding.
Yearlings (Trial 1; Nebraska 1998) CP (%) UIP (%) P (%) CTL 13.6 4.48 .34 Fin 1 11.2 3.67 .24 Fin 2 11.9 3.67 .24 Fin 3 11.5 3.67 .22
Performance : Yearlings Item Control Balanced SE Initial Wt. 652 660 2.8 Final Wt. 1249 1249 9.8 DMI 26.2 25.0* .2 ADG 4.06 4.01 .06 F/G 6.45 6.21 Erickson, et al; 1998
Phosphorus Balance (lbs/hd) Item Control Balanced 135 d/period for both yearlings and calves treatments
Treatment LW (lb) N Retention (g/d) Period (days) CTL TBA + E2 CTL TBA + E2 -14 777 774 19.3 23.2 + 7 821 834 21.6 43.6* +28 876 906 21.0 52.1** +49 902 972 19.6 57.0** +70 953 1043 18.5 36.5* Effect of TBA + E2 onNitrogen Retention of Steers Lobley et al, 1985; Br. J. Nutr. 54:681-694.
Phosphorus Balance Item CTL IMP P Intake, g/d 26.14 27.19 Pm, g/d 6.89 6.99 Carcass Protein Gain, g/d 114 207 WB Protein Gain, g/d 142 259 Pg, g/d 5.54 10.10 P Excreted, g/d 20.6 17.09 P Calculated (.68) g/d 18.3 25.1 P Excess, g/d 7.8 2.09
Nitrogen • Pigs require amino acids, not protein • Use synthetic amino acids
Synthetic Lysine • Replace 100 lbs of SBM with 3 lbs synthetic lysine and 97 lbs of corn • Save $3.96/ton • Corn @$1.70/bu & SBM @ $205/ton • Save $1.32/pig • Reduce N excretion by 22% • Reduce odor from ammonia
Split-Sex Feeding • Gilts eat less feed and put on more lean tissue • Feed gilts higher AA < 80 lbs • Save $1.40/pig • Reduce N excretion by 5%
Phase Feeding • By feeding more diets, you decrease the amount of time you are over-and under-feeding AA. • By using 5 Grower-Finisher diets instead of 2, save $1.60/pig • Decrease N excretion by 5-8%
Genotypical Feeding • Pig will only perform to genetic capability. • Increasing protein/AA levels to a genetically average pig will NOT increase muscle. • Match genetics to nutrition • Reduce N excretion & odor • Save $$$$
Antibiotics • Some preliminary data shows that certain antibiotics may be nitrogen sparing. • Potentially less N excretion and ammonia production
Balance on Available Amino Acids • When using something besides a corn-SBM diet • Add less N to the diet • Reduce N excretion and ammonia production
Reducing Sulfur Excretion • Amino acids • methionine • cysteine • Minerals • copper sulfate • ferrous sulfate
Dietary Modifications • Reduced protein from 13 to 8% and added synthetic AA to meet requirement • Replaced copper sulfate with copper oxide • Replaced ferrous sulfate with ferric chloride
Results • Reduced N in manure by 45% • Reduced volatile fatty acids (VFA’s) by 61% • Reduced sulfur compounds in air by 63%
Adding 5% Cellulose to Diet • Reduced pH from 7.8 to 6.4 • Reduced ammonia emissions by 68% • Reduced sulfur volatile organic compounds by 12%
While these may not all be practical at the present, it does demonstrate that we can affect nutrient excretions by how we feed the pig.
Phosphorus (P) • Only 30% of P in grain is available • Rest is in phytate form and is unavailable
Add Phytases • Phytases are enzymes that make phytate P more available • Reduce P excretion by 30% • Add less dicalcium phosphate • Economic“wash” when compare to dical price • Some reports of slight savings
Cost of P Excretion • It takes 3 times more land to spread hog manure on when you base the recommendation on P instead of N • Potential BIG cost in the future
Low Phytate Corn • “Gene Jockeys” and plant breeders have developed corn varieties with very low levels of phytate P. • Commercially available in a year or two
Distiller’s Dried Grains from SD & MN • Research on DDG from SD & MN ethanol plants shows that P is 60% more available from their products • Tremendous opportunity for gestating sows and finishing pigs • Low in lysine
Balance on Available P • Do when using other feedstuffs than corn and soybean meal • Add less inorganic P (cheaper) • Less P excretion
Improving Feed Efficiency • Anything that improves feed efficiency will decrease feed in the dust or the amount of feed ending up in the manure, thereby reducing the nutrient load in the manure and the substrate for odor production.
Improving Feed Efficiency • Fat additions (1% most economical) • Proper feeder adjustment • Pelleted diets • Wet/dry feeders • Growth promotants • Covers on drop-spouts
Conclusions • Environmental issues will continue to be important in the livestock industry. • By utilizing certain nutrition schemes and management tools we can theoretically lower our inputs and outputs of N and P. • We all need to do our job in protecting the environment.