Download
1 / 24
240 likes | 400 Views
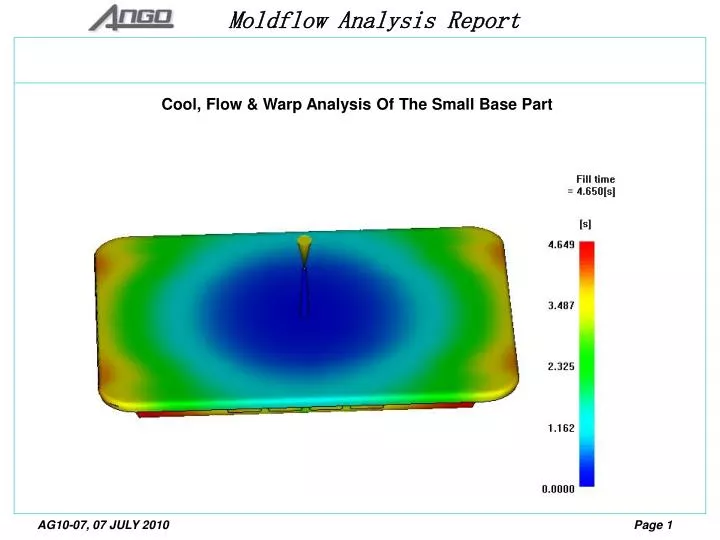
Cool, Flow & Warp Analysis Of The Small Base P art. Contents. Summary. ANALYSIS AIMS To study the flow and to predict the cy cle time of the A1309-2 part. ANALYSIS APPROACH The cavity and the cold runner sections are modeled. A Fusion Cool + Flow + Warp analysis was conducted.

E N D
Summary ANALYSIS AIMS To study the flow andto predict the cycle time of theA1309-2part. ANALYSIS APPROACH The cavity and the cold runner sections are modeled. A Fusion Cool + Flow + Warp analysis was conducted. The specified material is PP (grade is specified BP RPP 2009 GK BLK, which is not listed in the moldflow database, so we used Polypropylene PPC 5660 from TOTAL Petrochemicals) to run the analysis . This may effect the actual values obtained in the analysis (e.g. shrinkage values, pressure requirements), but it can still be used to observe the general trends in the results (e.g. filling pattern, warpage shape etc). CONCLUSION A pressure drop of 15MPa is expected across the system which indicates this material can easily fill this part. The overall melt front temperature drop is 1.2 C across the part, which is acceptable. The weld lines might be visible to the eye due to zero degrees of two melts. The part is expected to have warpage in X,Y,Z direction. Please refer to the data of the particular warpage on page 19 to 22. The hot spots in the slider side are due to the placement of the cooling channel. These areas need cooling circuit or beryllium insert added to them if possible (refer to page 18).
Material : PP Similar Material Trade Name: Polypropylene PPC 5660Manufacturer : TOTAL Petrochemicals Material Family: PP Recommend processing temperature Melt : 200C – 260C Mold : 20 C – 60 C Characteristics : Amorphous Material Viscosity Index : VI(240)0111 others: Melt mass –Flow Rate(MFR)(230C/2.16kg) 7.0g/10min Conductivity : 0.1762 W/m/C (at 230C) Specific Heat : 2618.6 J/kg/ C (at 230 C) Melt Density : 0.74577 g/cm^3 Absolute Max Temp : 300 C Ejection Temperature : 95C Max Shear Stress : 0.25MPa Max Shear Rate : 100,000 l/s PVT Plot Viscosity Plot
Part thickness Use different color to show the thickness.
Part thickness Use different color to show the thickness.
Processing Condition & Runner Layout The Processing Conditions used was as follows: Filling Time : Auto, 4.6 sec. Mold Temperature : 40 C Melt Temperature : 230 C Velocity/Pressure switchover at 98.5% volume fill Packing Pressure : 80% of Max Injection Pressure Gate size: Ф7.8mm
Filling Pattern Fig 1 Fig 2 Fig 3 Fig 4 The last filling area
Pressure drop A pressure drop of 15MPa is expected across the system, this indicated that the material is easy to fill this part.
Temperature at flow front The plastics material enters the runners at 230 C. The overall temperature drop is about 1.2C, which is acceptable.
Weld Lines The weld lines (color curve) might be visible to the eye, due to the zero degrees of the two melts.
Air traps The air traps (pink marks ) location are as show.
Cooling Channels : Temperature Rise The coolant is specified as water at 25 C, and with turbulent flow in each channels (Reynold Number = 10,000). The outlet temperature of each channels exceeds0.66C, this indicates the cooling channels are efficient. Cavity cooling
Cooling Channels : Temperature Rise The coolant is specified as water at 25 C, and with turbulent flow in each channels (Reynold Number = 10,000). The outlet temperature of each channels exceeds0.8C, this indicates the cooling channels are efficient. Core cooling
Cooling Channels : Temperature Rise Slider cooling
Mould Surface Temperature Total Cycle time: 105 sec. ( Auto Injection + Packing + Cooling Times = 100 sec. Mold open time = 5 sec.) Core side Cavity side Hot spot Slider Slider
Warpage in Z direction Z direction
The conclusions 1) This product was analyzed by using Moldflow software. The directions of the shrinkage is due to structure of the product. 2)There’s not enough cooling of the slide and core. Suggestions: to improve this, use the Heat Pipes on the slide area instead and increase water cooling system on the core area, But these are just some minor adjustments, the deformation will still be prominent. 3) The large base mold has the same problems.