Download
1 / 20
280 likes | 724 Views
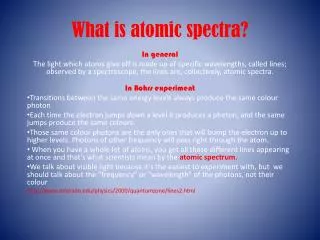
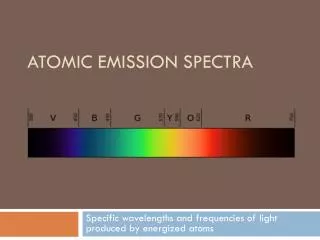
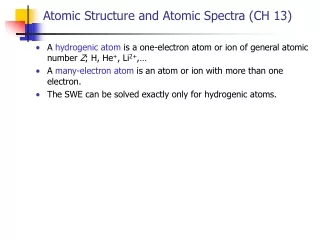
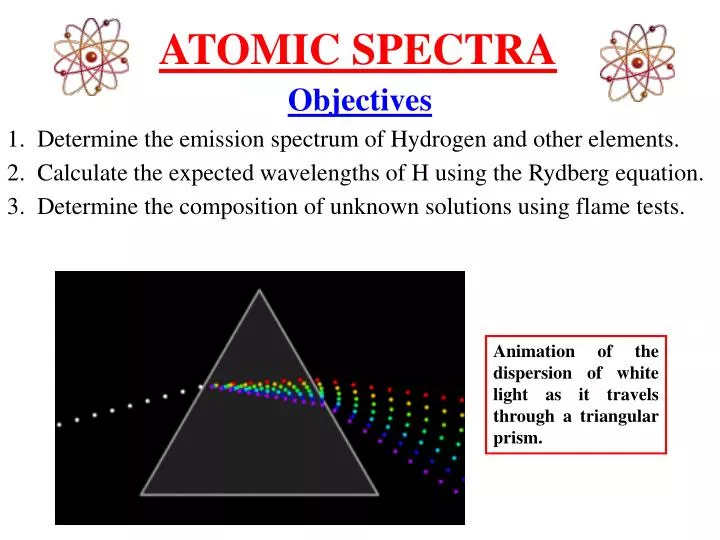
ATOMIC SPECTRA. Objectives 1. Determine the emission spectrum of Hydrogen and other elements. 2. Calculate the expected wavelengths of H using the Rydberg equation. 3. Determine the composition of unknown solutions using flame tests.

E N D
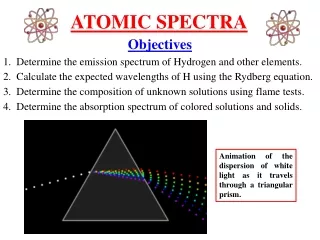
ATOMIC SPECTRA Objectives 1. Determine theemission spectrum of Hydrogen and other elements. 2. Calculate the expected wavelengths of H using the Rydberg equation. 3. Determine the composition of unknown solutions using flame tests. Animation of the dispersion of white light as it travels through a triangular prism.
History of Optics & Light Studies Ibn Alhazen is considered the “Father of Optics” He wrote the “Book of Optics”, which correctly explained and proved the modern theory of vision. His experiments on optics greatly influenced later scientists. His experiments included ones on lenses, mirrors, refraction, reflection, and the dispersion of light into its constituent colors. He studied the electromagnetic aspects of light, and argued that rays of light are streams of energy particles traveling in straight lines. Ibn Alhazen (965 – 1039) Arab Muslim Scientist “Father of Optics” http://www.hulu.com/watch/135530/milestones-in-science-and-engineering-joseph-fraunhofer-and-the-spectral-lines
Atomic Spectra Experiment • PART A: Hydrogen emission spectrum. • PART B: Emission spectrum of other elements. • PART C: Flame Tests (organic & inorganic).
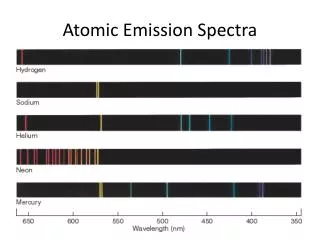
PART A: Calculate the wavelengths for Hydrogen and compare them to the Hydrogen line spectrum from a Scanning Spectrophotometer. The hydrogen line spectrum contains only a few discrete wavelengths. In the visible region, there are only four wavelengths.
Hydrogen Spectrum – The Balmer Series In 1885,Johann Jakob Balmer analyzed the hydrogen spectrum and found that hydrogen emitted four bands of light within the visible spectrum. His empirical formula for the visible spectral lines of the hydrogen atom was later found to be aspecial case of the Rydberg formula, devised by Johannes Rydberg. Johann Jakob Balmer (May 1, 1825 – March 12, 1898) Swiss Mathematician & Honorary Physicist
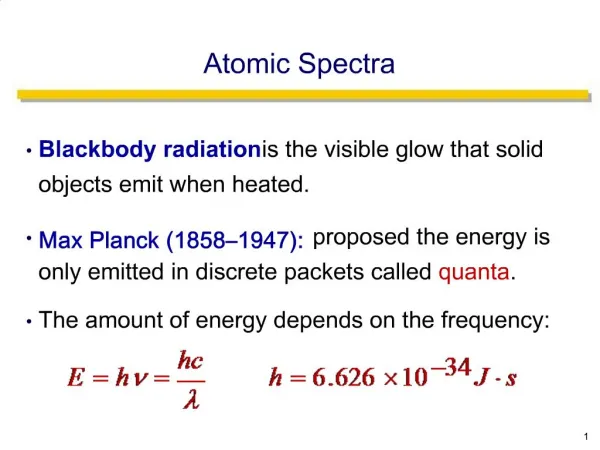
Quantum Properties of Light E = nh E – the change in Energy n= 1, 2, 3, … h – (Planck’s constant) h = 6.62610-34 Js = frequency Max Karl Ernst Ludwig Planck (April 23, 1858 – October 4, 1947) German Physicist The Nobel Prize in Physics 1918 for The discovery of energy quanta. The profile of radiation emitted from a black body In 1900, Planck hypothesized that energy was quantized (i.e. energy can be gained or lost only in whole-number multiples of the quantity h.) This hypothesis was later extended by Albert Einsteinto include light. Einstein envisioned light as small discrete particles of energy which he called photons.
To calculate the wavelengths (p 65) – Recall that Frequency and Wavelength are related where frequency times wavelength equals the speed of light. Wavelength (): Distance between two consecutive peaks [unit: nm] Frequency (): Number of waves per second that pass a given point in space [unit: s-1 (Hertz)] = c Where C is the speed of light & C = 2.9979108 m/s = c / Since the speed of light is a constant, as wavelength decreases, then frequency must increase.
Calculating the Balmer & Lyman Series As noted earlier, the four bands of light calculated by Balmer could be simply calculated using the Rydberg equation: * Where v = frequency n = the quantum number R =(Rydberg constant) R = 3.29 1015 Hz 1 Hz = 1 s-1 The permitted energy levels of a hydrogen atom. *This equation will be used on page 65.
In 1913, Bohr developed a quantum model for the hydrogen atom. • Proposed the Solar System model of the atom where the electron in a hydrogen atom moves around the nucleus only in certain allowed circular orbits. Niels Henrik David Bohr Oct. 7, 1885 – Nov. 18, 1962 Danish Physicist The Nobel Prize in Physics 1922 for the investigation of the structure of atoms and of the radiation emanating from them. These orbits then correspond to the energy levels seen in the Balmer series. (p 71)
Scanning Spectrophotometer (top view) A hydrogen light source will be viewed using a scanning spectrophotometer. The wavelengths will be calculated for the Balmer and Lyman series and then compared to those generated by the computer attached to the scanning spectrophotometer.
Computer Output from a Scanning Spectrophotometer The peaks on the spectrograph correspond to the energy changes of the electrons for the Hydrogen atom.
PART B: Emission spectrum of other compounds using The STAR Spectrophotometer. • View the line spectrum through the STAR Spectrophotometer • - point arrow towards the light and view to the left. • 2. Verify that the scale is lined-up accurately by looking at the fluorescent light. In addition to other lines, you should see a green doublet for mercury at ~570 nm (the scale on the bottom). 3. Measure the line spectrum of the gas tubes set up in Room 201. 4. Compare your results with literature values. http://physics.nist.gov/PhysRefData/ASD/lines_form.html
Emission Spectra Complement Absorption Spectra The emission spectrum we see is the complement to the mysterious dark lines (Fraunhofer lines) in the sun's spectrum. It is now possible to identify the chemical composition of elements and distant objects like the sun and other stars. This is because the Fraunhofer lines in the solar spectrum were due to the absorption of light by the atoms of various elements in the sun's atmosphere.
Atomic Spectra of Noble Gases Helium Neon Argon Krypton The Atomic Spectra will be determined for the Noble Gases by looking at the gas discharge tubes.
PART C: Flame Test (Organic Compounds) Beilstein test If a clean copper wire is coated with a halogen-containing compound and placed in a flame, the presence of the halogen is revealed by a green to blue color. It is often possible to distinguish between chlorine, bromine and iodine based on the color of the flame.
Flame Tests • Flame Test:A test used in the identification of certain elements. • It is based on the observation that light emitted by any element gives a unique spectrum when passed through a spectroscope. Flame spectrum for lithium
Flame tests and identification of unknown metal solutions. Observe and record the color of the flame for each known sample.Then determine the unknown compound based on the comparison between its flame color and those of the known samples.
Checkout – (All items checked out should be returned) 1-STAR Spectroscope 1-nichrome flame test loop 1-copper Beilstein test loop 5 test tubes with unknowns for Flame Test & 1 with 6M HCl for cleaning loops In Lab Flame test knowns– in hoods (look for signs) Beilstein test for Part C (page 69) – in hoods 6M HCl for cleaning Beilstein loops – in hoods Gas discharge tubes (for viewing by STAR spectroscope) – in 201 Computerized spectrophotometer – 1 setup in 201 All students View Scanning Spectrophotometer for Part A (page 65) in Room 201. You will need to get page 65 signed by presenter. View Gas Discharge tubes for Part B (page 67) in Room 201. You may do flame tests on unknowns using your own Bunsen burner at your desk.
Hazards 6M HCl – strong acid, corrosive (use solid NaHCO3 on spills) CH2Cl2- halogenated volatile organic solvent Bunsen Burner – open flames Waste Liquid waste-all waste, heavy metals, acid, rinses This Week: Turn InAtomic Spectra Handout (pp 65-67). Review Session– Wednesday, Apr. 18, 6-8 pm in G3. Evaluation Forms: To evaluate Chem 2, you should be receiving an email from the CET committee with the following link: https://itweb.mst.edu/auth-cgi-bin/cgiwrap/distanceed/evals/survey.pl
Next Week (April 26-29) *Final Exam – 1 Hour Exam during regularly scheduled class time*. You will need a calculator. **Checkout after exam. $35 fine for not checking out. (This means NO Chem 2 Final during Finals Week.) *If you need to take the test on a different day, email Dr. Bolon. ************************************************* Don’t be a Dumb Bunny! - Study! * *It’s a biology joke!