Download
1 / 45
450 likes | 519 Views
Program Accountability Budget and Performance Integration. DOI Annual Business Conference March 2006. U.S. Department of the Interior U.S. Geological Survey. Customer Driven. Science Driven. Congress Driven. Administration Driven. PART. 5-Year Plans. President’s Budget. Approp. Bill.

E N D
Program AccountabilityBudget and Performance Integration DOI Annual Business Conference March 2006 U.S. Department of the Interior U.S. Geological Survey
CustomerDriven ScienceDriven CongressDriven AdministrationDriven PART 5-YearPlans President’sBudget Approp.Bill GPRAStrategicPlan CPIC PMA Earmarks & Legislative Mandates InteragencyCrosscuts & Initiatives Partnerships Drivers and Vehicles ScienceRequirements
Program Performance Reporting Cyclic Annual Continuous Quarterly Internal Program Reviews DOI Accountability Report PART Milestones PART Performance External Program Evaluations USGS Accountability Report FFS GPRA Performance ABC/M Director’s Assurance Statement PMA Scorecards IG/GAO Reviews T&A Management Control Reviews (MCRs) Employee Performance Appraisal CPIC Cost / Milestones
Department of the Interior MISSION AREAS AND OUTCOME GOALS P A R T N E R S H I P S USGS goals • Resource Use • Manage or Influence Resource Use to Enhance Public Benefit, Promote Responsible Use, and Ensure Optimal Value: Energy, Minerals, Forage, Forest Products • Deliver Water and Generate Hydropower, Consistent with Applicable Federal and State Law, in an Environmentally Responsible and Cost Efficient Manner • Resource Protection • Improve the Health of Watersheds, Landscapes, and Marine Resources that are DOI Managed or Influenced in a Manner Consistent with Obligations Regarding the Allocation and Use of Water • Sustain Biological Communities on DOI Managed and Influenced Lands and Waters in a Manner Consistent with Obligations Regarding the Allocation and Use of Water • Protect Cultural and Natural Heritage Resources MA N A G E M E N T • Recreation • Provide for a Quality Recreation Experience, Including Access and Enjoyment of Natural and Cultural Resources on DOI Managed and Partnered Lands and Waters • Provide for and Receive Fair Value in Recreation • Serving Communities • Protect Lives, Resources and Property • Advance Knowledge Through Scientific Leadership and Inform Decisions Through the Applications of Science • Fulfill Indian Fiduciary Trust Responsibilities • Advance Quality Communities for Tribes and Alaska Natives • Increase Economic Self-Sufficiency of Insular Areas SCIENCE DOI Strategic Plan “Guardians of the Past; Stewards of the Future”
DOI Strategic Plan – DOI Science • Science is presented as the foundation for informed resource management decisions • Includes all Bureaus • Outcome Oriented at Department Level • Output Oriented at Bureau Level • Links Costs and Outputs to • – End Outcome Goals • – DOI focus is shifting to costing measures
DOI Strategic Plan Mission Area USGS Strategic Plan USGS Program 5-Year Science Plan Systematic analyses and investigations delivered to customers Long-term data collections maintained % of customers for whom energy data meet their needs PART Output Outcome Number of systematic analyses and investigations delivered to customers Number of formal workshops or training provided to customers Average cost of a systematic analysis or investigation % of targeted analyses/investigations delivered which are cited by identified partners within 3-years of delivery Research & Development General Purpose Data & Statistics Advising & Consulting Knowledge Dissemination Government Services Delivery: Knowledge Creation and Management President’s Business Reference Model: Mode of Delivery Business Area
PART PART Sections • Program Purpose and Design (20%) • To assess whether the program design and purpose are clear and defendable • Strategic Planning (10%) • To assess whether the agency sets valid annual and long-term goals for the program • Program Management (20%) • To rate agency management of the program, including financial oversight and program improvement efforts • Program Results (50%) • To rate program performance on goals reviewed in the strategic planning section and through other evaluations
Activity Based Costing (ABC)Tool for Budget and Performance Integration
Performance Model Work Output Outcome StrategicGoal Mission
STRATEGIC PLAN GOAL i.e., Resource Use ABC ABC ABC WORK ACTIVITIES WORK ACTIVITIES WORK ACTIVITIES STRATEGY Intermediate Outcome i.e., Improve Information Base resource mgmt. 1:1 1:1 1:1 OUTPUT (…are costed and unique to this strategy) OUTPUT (…are costed and unique to this strategy) OUTPUT (…are costed and unique to this strategy) $/OUTPUT ABC and Strategic Plan Interface
FY 2005 ($1,410,151,709) Serving Communities 228,058,902.59 (16%) 1,101,952,129.68 (78%) Resource Protection 80,140,676.27 (6%) Resource Use USGS ABC ActivitiesFY 2004 vs. FY 2005 $1,200,000,000 $1,000,000,000 $800,000,000 $600,000,000 $400,000,000 $200,000,000 ServingCommunities ResourceProtection ResourceUse $0 FY 2005 FY 2004 ABC: Expenditures by Mission Area
FY 2005Total Expenditures ($1,410,151,709) 75,992.62 (0%) CONDUCT ASSESSMENTS 0.00 (0%) 43,547,060.46 (3%) 92,208,564.25 (7%) 204,825,839.77 (15%) CONDUCT RESEARCH DATA COLLECTION MANAGE & DISTRIBUTE DATA 242,317,043.13 (17%) PLAN/EVALUATE TECHNICAL ASSISTANCE SUPPORT (Science Management) 58,524,995.25 (4%) 33,466,648.65 (2%) SUPPORT (Sustain Org.—excluding IT) SUPPORT (Indirect IT) SUPPORT (Sustain Org.—No ABC) 100,787,652.47 (7%) 397,281,835.74 (28%) CONDUCT EMERGENCY RESPONSE ACTIVITIES 237,116,076.20 (17%) ABC: Expenditures by Work Activity
USGS by ABC ActivitiesFY 2004 vs. FY 2005 28% $400,000,000 28% $350,000,000 23% $300,000,000 17% $250,000,000 17% 15% 15% $200,000,000 12% $150,000,000 8% 7% $100,000,000 7% 6% 4% 4% 3% $50,000,000 2% 2% 2% 0% 0% $0 ConductAssessments ConductResearch DataCollection Manage &Distribute Data Plan/Evaluate Support(Science Mgmt.) TechnicalAssistance Support(Sustain Org.,excluding IT) Support(Indirect IT) ConductEmergencyResponseActivities FY 2004 FY 2005
Impact • “Science” is not enough • Positive outcomes are not enough • Strategic planning, science objective setting, and performance management are necessary to demonstrate why your program is a good investment
Great Expectations – DOI • Constant scrutiny on performance in all aspects of business and mission delivery • Continuous improvement • Drive to consistency across the Department • Focus on unit cost of performance and marginal cost of change (ABC/M + GPRA = performance budget) • Document costing methodology, unit and total cost of performance in the FY 2008 Budget
Great Expectations – OMB • PART role increasing on all counts – continuous program improvement plans • FY 2007 PART and other program evaluations were used to justify new $$ • FY 2008 PART, PMA, cost analysis, and demonstrate an intent to implement governmentwide line of business for budget and performance integration • Increased scrutiny guaranteed • Increased pressure to get to Green on PMA s and R&D scorecard
Great Expectations – OMBPART: the gift that keeps on giving Every program that has been PARTed has a set of follow-up actions (also known as an improvement plan) it is taking to address PART findings and improve program performance. The improvement plan is a key element of the PART summary. Implementation of improvement plans will be tracked for all agencies and will be considered in the Budget and Performance Integration scorecard for the major agencies. OMB staff and agencies should give particular focus this year to developing aggressive follow-up actions that will improve performance. Programs that were assessed in earlier years should be adding new follow-up actions to their improvement plans as they complete old ones. These new actions may be logical next steps to completed actions or new actions relating to PART findings that have not been addressed yet. Robert Shea, Counselor to OMB Deputy Director for Management, October 2005 memo
Great Expectations – Congress A focus on results, as envisioned by GPRA, implies that federal programs contributing to the same or similar results should collaborate to ensure that goals are consistent and, as appropriate, program efforts are mutually reinforcing. Federal agencies can use their strategic and annual performance plans as tools to drive collaboration with other agencies and partners and establish complementary goals and strategies for achieving results. Such plans can also reinforce accountability for the collaboration by aligning agency goals and strategies with those of the collaborative efforts. Accountability for collaboration is reinforced through public reporting of agency results. RESULTS-ORIENTED GOVERNMENT Practices That Can Help Enhance and Sustain Collaboration among Federal Agencies October 2005 Report to the Chairman, Subcommittee on GAO Oversight of Government Management, the Federal Workforce, and the District of Columbia, Committee on Homeland Security and Governmental Affairs, U.S. Senate GAO-06-15
Great Expectations – Congress As a first step in reinforcing individual accountability for collaborative efforts, agencies set expectations for senior executives for collaboration within and across organizational boundaries in their individual performance plans. For example, as part of its Senior Executive Service (SES) performance management system, Interior, one of the agencies involved in wildland fire management, requires all of its senior executives to incorporate in their individual performance plans a competency related to collaboration—“Building Collaboration and Partnerships with customers/Partners/ Stakeholders.” Specifically, for this competency, senior executives are to communicate, consult, and cooperate with customers, partners, and stakeholders to ensure that Interior’s missions and programs effectively empower citizens in the support of conservation. According to an Interior official, Interior’s bureaus have the flexibility to cascade the required senior executive competency related to collaboration to their non-SES employees’ individual performance plans. RESULTS-ORIENTED GOVERNMENT Practices That Can Help Enhance and Sustain Collaboration among Federal Agencies October 2005 Report to the Chairman, Subcommittee on GAO Oversight of Government Management, the Federal Workforce, and the District of Columbia, Committee on Homeland Security and Governmental Affairs, U.S. Senate GAO-06-15
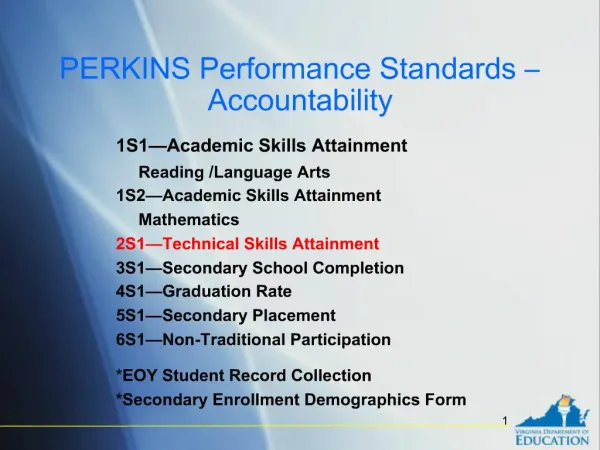
Where’s USGS – Performance?? • Performance Data V&V for “all” measures (not just key) using DOI methodology • 9 Programs PARTed using R&D criteria • 1 effective • 8 moderately effective, • no RND • PART Efficiency Measures for all PARTed Programs (in DOI MITS system) • PART Improvement Plan Milestones for all PARTed Programs (in DOI MITS system) • Shared performance measures developed with other Bureaus and Agencies in the PART process
Where’s USGS – Performance Review?? • DOI Quarterly Review Status of Performance and Funding Investment and PMA Scorecards • USGS Quarterly Status of Funds and Performance Reviews instituted in FY 2005 • status of performance measures • high level cost data for senior managers • over 550 different views (pie charts) of ABC cost data for goals, regions, programs, activities, etc. compiled and posted on Intranet for managers’ • Database of GPRA measure targets, PART measure targets and improvement milestones, Secretarial MBOs, Congressional directives, OMB passback directives, budget commitments, etc created for SES/SL and employee performance plans in progress
Where’s USGS – ABC Progress?? • Laying groundwork to • Maintain the correct balance of monitoring, assessment, data management and research for the long-term viability of the programs • Monitor long term trends and define regional patterns for the kinds of work partners need • Monitor operations to mitigate the effect of erosion of buying power on priorities • Identify efficiencies in operations to increase funding for new priorities • Continuing to verify and validate data application • Several years of implementation will be needed to identify trends in the data that can lead to programmatic decisions
Where’s USGS – ABC Costing Process?? • Budget and Science Information System (BASIS+) – used for project planning and ABC coding • FFS reports ABC expenditures • Common GPRA output measures/ABC Activity Outputs derived in workshops FY 2004 • Analysis of ABC data led to process change in FY 2006 – coding at task rather than project level to gain granularity
Where’s USGS – ABC Costing Status?? • Outputs are “costed” using ABC • Some are true annual costs (ex. data collection, data management ) • some are surrogate annual cost (systematic analyses, assessments) • Costing aggregates to end outcome goals • All budgetary resources – direct and reimbursable– cost to end outcome goals • Statement of net cost segment reporting to end outcome goals • Costing to performance measures is problematic
Where’s USGS ??Performance Measure Costing Challenges • Strategic Plan was not designed to cover all of the budget • Non-linear Strategic Plan – no direct line from output to intermediate to end outcome • Only 2 of 6 end outcome goals have relevant end outcome measures for USGS • USGS does not manage land or resources so focuses on intermediate outcomes for Resource Protection and Resource Use • Serving Communities has relevant end outcome measures
Where’s USGS ?? Performance Measure Costing Challenges • Many measures are not budget sensitive and not costed • Performance measures are not mutually exclusive, may measure different aspects of the same work • Costing methodologies meaningful for programs and field applications are not standardized across the organization • ABC’s annual capture of expenditures • requires use of surrogate costs for multi-year outputs • does not support some PART efficiency measures that will continue to be costed manually
Gas Hydrates Heavy Oil Natural Bitumen Coal and Coalbed Methane Oil and Natural Gas Geothermal Oil Shale Uranium Energy Resources Program provides reliable, impartial scientific information and comprehensive analyses – Nation’s & World’s resources
The Nation faces simultaneous challenges: • increasing demand for energy • growing dependence imported resources • need to minimize environmental effects • The ERP addresses these challenges by promoting and supporting scientific investigations of geologically based energy resources (research on the geology of oil, gas, and coal resources, emerging resources such as gas hydrates, underutilized resources such as geothermal, and research on the effects associated with energy resource occurrence, production, and (or) utilization) • The results provide impartial, robust scientific information about energy resources and directly support the U.S. Department of Interior’s Mission of protecting and responsibly managing the Nation’s natural resources
Mission of the Energy Resources Program (1) To understand the processes critical to the formation, accumulation, occurrence, and alteration of geologically based energy resources; (2) To conduct scientifically robust assessments of those resources; and (3) To study the impact of energy resource occurrence and (or) production and use on both environmental and human health.
Seven long-term goals improve the understanding of: • the oil and natural gas endowment of the U.S. and World; • 2. the coal endowment of the U.S; • 3. the occurrence and distribution of, and conduct research in support of, making natural gas hydrates a technically producible resource; • 4. the distribution and resource base of other geologically based energy resources, such as geothermal resources; • 5. the environmental and human health effects of energy resource occurrence and utilization; • 6. Maintain state-of-the-art data management and distribution systems; and • 7. Partner with other organizations, including donor organizations, to address domestic and international issues regarding geologically based energy resources.
>60,000 analyses Products (Outputs) Include: Energy Resource Assessments Geology-based understanding of: framework of resource occurrence processes yielding resource accumulations economic, technical, and environmental factors affecting resource availability and recoverability
ERP—Metrics and Our Mission • Research, Characterization, Assessments • Energy Policy Act Amendments of 2000 • Energy Policy Act of 2005 • Science support for other agencies • PART • GPRA and project productivity • Efficiency measurements and efficiencies
ERPAnnual Planning, Review and Budget • Annual guidance • Program Council • Interactive, on-going basis • BASIS work plans—a contract • Review (internal and external) • Budget allocation based in part on performance • End of year fiscal analysis
ERP—PART and Performance • Recasting our science in another language to another audience • Engaging our partners • Focusing on outcomes • Better understanding of program • Strengths • Weaknesses • Suggestions for improvements
ERP—Performance and Perspective • Proactive vs. Reactive Management • Critical partnerships • Long-range vision • Taking ownership • Outputs vs. Outcomes • Leveraging • Roles, Responsibilities and Money
FY 2005 Landslide Hazards Program ABC by Project $2,461,766 (81%) $317,017 (10%) FY 2005 Landslide Hazards Program $264,345 (9%) ABC by Task $452,999 (15%) Bureau/Discipline Costs Plan/Evaluate Programs Collect Data $264,345 (9%) $1,846,777 (61%) $317,017 (10%) $44,541 (1%) $117,449 (4%) Bureau/Discipline Costs Plan/Evaluate Programs Collect Data Conduct Research Provide Tech. Assistance Conduct Assessments ABC/M – Granularity in Coding
ABC’s – Programmatic Challenges • PART efficiency measures – ABC’s • Project focus and ABC costing, e.g.:::
A Work in Progress ABC’s Programmatic Payout