Download
1 / 53
950 likes | 2.15k Views
Managerial Epidemiology. Ty Borders, Ph.D. Assistant Professor Department of Health Services Research & Management Texas Tech School of Medicine. Learning objectives. Define epidemiology Explain the role of epidemiology in health care management

E N D
Managerial Epidemiology Ty Borders, Ph.D. Assistant Professor Department of Health Services Research & Management Texas Tech School of Medicine
Learning objectives • Define epidemiology • Explain the role of epidemiology in health care management • Calculate major descriptive epidemiologic indicators • Understand what are the more prevalent diseases and disorders in the U.S. • Calculate and interpret Relative Risk • Calculate and interpret Odds Ratio • Understand types and purposes of analytical studies
What is Epidemiology? • Study of the distribution and determinants of disease • The doctrine of what is among or happening to people • Epi: among • Demos: people • Logos: Doctrine Note: from Charles Lynch, M.D., Iowa College of Public Health
History of epidemiology 1662, John Graunt a petty merchandiser in London, publishes a report on births and deaths in London. First to quantify disease patterns. 1839, William Farr a physician, establishes system for routine compiliation of no. and causes of death in England and Wales 1855, John Snow a physician, studied whether drinking water in Soutwark and Vauxhall increased risk of cholera
Subfields of Epidemiology • Clinical epidemiology (patients) • Social epidemiology (populations) • Genetic epidemiology (patients/populations) • Health services epidemiology (populations/patients)
A broader definition • Study of the distribution and determinants of health-relatedevents and states • Utilization of health services • Health-related quality of life • Satisfaction with care
Managerial Epidemiology Epidemiological methods applied to the... I. Evaluation of community health care needs II. Study of health services utilization (access) III. Health outcomes research (study of the impact of health care services on health outcomes) • Effectiveness • Patient satisfaction • Health-related quality of life
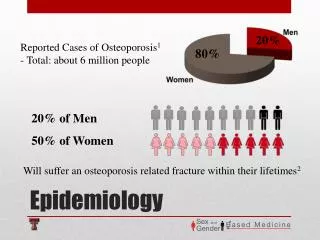
I. Evaluation of community health care needs • Descriptive morbidity and mortality indicators • Cancer incidence and mortality rates • Infectious disease rates • Infant mortality rate • Descriptive social and demographic indicators • Median income, unemployment rates, etc. • Market research surveys
II. Utilization Population Characteristics Environment Behavior Outcomes Perceived health status Personal health practices Health care system Evaluated health status Predisposing Enabling Need Use of health services External environment Consumer satisfaction
III. Health outcomes research • Study of the quality of health services • This includes the effectiveness of health services • Results from RCTs may not apply in real world • A number of factors influence who receives a treatment • A treatment may be more/less effective for particular subgroups
Descriptive vs. Analytical epi. • Descriptive epidemiology • Study of the amount and distribution of disease within a population by person, place, and time • Provides info. on patterns of disease occurrence by age, sex, race, marital status, etc. • Analytical epidemiology • Study of the determinants of disease or reasons for relatively high or low frequency in specific groups
Biologic Concepts • Agent-Host Environment • An agent interacts with a host in a particular environment to produce disease (the epidemiologic triangle) Host Vector Agent Environment
Biologic Concepts • Almost all diseases have multiple causes • Necessary and sufficient • Without the factor, the disease never develops • Necessary but not sufficient • Requires multiple factors • Sufficient but not necessary • Factor can produce disease, but so can other factors • Neither sufficient nor necessary • Probably represents causal relationships in most chronic diseases
Examples of routes of transmission Agent Disease Respiratory Cigarette smoke Lung cancer Influenza virus Flu Gastrointestinal Vibrio cholera Cholera Lead Lead poison. Sexual transm. Papilloma virus Cervical cancer Perinatal exposure Rubella virus Cong. Defects Blood stream exp. Clostridium tetani Tetanus & skin breakage
Incubation or Induction Period • The period of time between exposure to a causative agent and the appearance of first clinical manifestations Infection Incubation/induction/ latent period Disease Inapparent Mild Moderate Severe Fatal Likely to be seen by doctor Likely to be hospitalized
Study types • Descriptive studies • Population level: correlational, ecologic, or aggregate • Individual level: case reports, case series • Analytical, observational studies • Cross sectional survey • Case-control studies • Cohort studies • Analytical, intervention studies
Measures of disease occurrence • 3 measures used to assess the frequency of disease or other health events • Cummulative incidence (CI), also called Risk • Prevalence • Incidence density, also called incidence rate
Types of Incidence and Prevalence Measures Rate TypeNumer. Denom. Morbidity rate Incidence # new nonfatal Total pop. cases at risk Mortality rate Incidence # deaths from Total pop. a disease(s) Case-fatality rate Incidence # deaths from # of cases a disease of that disease Period Prevalence # existing cases Total pop. plus new cases diagnosed during given time period
Risk • Sometimes also called cumulative incidence • Proportion of unaffected individuals who, on average, will contract disease of interest over a specified period of time
Calculation of risk R = New cases Persons at risk R = 0 if no new occurrences arise R = 1 if the entire population becomes infected
Example We are interested in the risk of acquiring a nosocomial infection. A study was conducted on 5031 patients. 596 patients developed infection within 48 hours after admission. R = 596 / 5031 = 0.12 = 12%
Calculation of prevalence • Prevalence is a measure of the number of existing cases in a population. • Specifically, the proportion of a population that has a disease at aparticular point in time.
Prevalence P = Number of cases Number of persons in population • Prevalence, like risk, ranges between 0 and 1.
Incidence rate • Also called incidence density • Reflects the occurrence of new cases (like risk does) • But, also measures the rapidity with which event occurs
Calculation of incidence rate IR = New cases Person time
Calculation of incidence rate IR = New cases Person time
Example Patient A develops a disease 2 years after entry into study. Thus, the person-time for Patient A is 2 years. Patients B,C,D,E an F contribute 2,3,7,2 and 6 years, respectively. Thus, the number of person-years is 2+2+3+7+2+6 = 22. IR = new cases/ PT = 2 / 22
Summary Characteristic Risk Prev. IR What is Prob. % of pop. Rapidity measured of disease with dis. of dis. Occurrence Units None None Cases/person- time Time of disease Newly Existing Newly diagnosis diagnosed diagnosed Synonyms Cumulative - Incidence Incidence Density
Survival • Probability of remaining alive for a specific length of time • For chronic disease, like cancer, 1-year and 5-year survival are important indicators of prognosis and severity.
Calculation of survival Survival = A - D A D = number of deaths observed over a defined period of time A = number of newly diagnosed patients under observation
Calculation of survival Survival = A - D A D = number of deaths observed over a defined period of time A = number of newly diagnosed patients under observation
Types of rates • Crude rates • Rates presented for entire population • e.g. Cancer mortality rate in 1980 (416,481 cancer deaths / midyear U.S. population) • Category specific rates • Rates presented for individuals in specific categories • e.g. Cancer deaths among persons 45-54
Adjusted rates • If we are interested in the magnitude of the health problem, we don’t need adjusted rates • If we are interested in comparing populations, we need to adjust for differences
Adjustment methods • Take a weighted average of category-specific rates • Direct method • Indirect method
Pros/cons of crude, specific, and adjusted rates Type Strengths Limitations Crude Actual summary Difficult to interpret rates b/c populations may vary in composition Specific Homogeneous Cumbersome to compare subgroups many subgroups of 2 or more populations Adjusted Summary statistics Fictional rates Differences in Absolute magnitude composition removed depends on standard population chosen
Standardized mortality rate (SMR) • SMR = observed deaths / expected deaths = indirect adjusted rate / crude rate of standard pop. • Usually expressed as a percent
Person-years of life lost (in 1,000s) from leading causes of cancer, 1991 (from Greenberg, 1996)
Years of Potential Life Lost before age 65 by cause of death (per 100,000 person years) (from Greenberg, 1996)
Leading causes of death, 1996 Cause Frequency Heart disease 31.6% Cancer 23.4% Stroke 6.9% Chronic lung disease 4.6% Accidents 4.0% Pneumonia/influenza 3.6% Diabetes mellitus 2.7% HIV/AIDS 1.3%
Observational Studies • Cross - sectional • Provides estimate of the strength of association between a factor and outcomes or event • Can not determine timing of exposure • e.g. A telephone survey of rural residents conducted at one point in time • Case - control study • Compare the prevalence of exposure between 2 or more groups (i.e. cases and controls)
Observational Studies (cont.) • Prospective cohort studies • Retrospective (historical) cohort studies
Cohort Studies Onset of study Time Eligible subjects Disease Exposed No Disease Disease Unexposed No Disease Direction of inquiry
Comparison of prospective and retrospective studies Attribute Retrospective Prospective Information Less complete More complete Discontinued exposures Useful Not useful Emerging, new exposures Not useful Useful Expense Less costly More costly Completion time Shorter Longer from Greenberg et al.
Adv./Disadv. of cohort studies Advantages Disadvantages Direct calculation Time consuming of relative risk May yield info. on incidence Require large sample sizes Clear temporal relationship Expensive Can yield info. on multiple Not efficient for study of exposures rare events Minimizes bias Losses to follow-up Strongest observational design for establishing cause-effect from Greenberg et al.
Relative Risk Relative risk (or risk ratio) = ratio of two rates RR = incidence rate among exposed incidence rate among unexposed
Relative Risk Exposure Yes No Outcome Death a b a+b No death c d c+d a+c b+d RR = a/ (a+c) b/ (b+d)
Example of Relative Risk Apgar score 0-3 4-6 Outcome Death 42 43 85 No death 80 302 382 122 345 467 Risk among exposed = 42 / 122 = 34.4% Risk among unexposed = 43 / 345 = 12.5% RR = 34.4 / 12.5 = 2.8
Observational Studies (cont.) • Case - control study • Compare the prevalence of exposure between 2 or more groups (i.e. cases and controls) • Pairwise matching
Case-Control Studies Study Onset Time Onset of study Exposed Cases Unexposed Exposed Controls Unexposed Direction of Inquiry