Download
1 / 18
180 likes | 377 Views
Chapter 2. Foundations of Probability Section 2.2. Sample Space and Events. Jiaping Wang Department of Mathematical Science 01/14/2013, Monday. Outline. Syllabus Randomness Sample Space and Events Event Operator and Venn Diagram. Part 1. Syllabus. Syllabus: Part I.

E N D
Chapter 2. Foundations of Probability Section 2.2. Sample Space and Events Jiaping Wang Department of Mathematical Science 01/14/2013, Monday
Outline Syllabus Randomness Sample Space and Events Event Operator and Venn Diagram
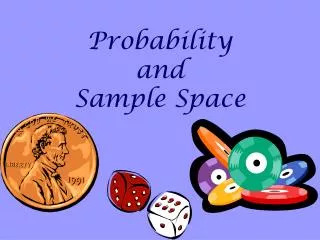
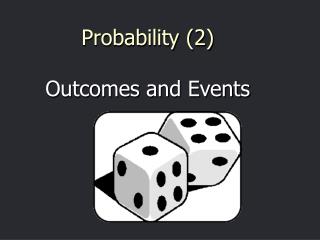
Sample Space Flip a coin: {Head, Tail} Roll a die: {1, 2, 3, 4, 5, 6} President Election: {Tom, Jerry} Measuring your height: {X|X>0} Final Grades: {X|0<=X<=100} Letter Grades: {A, B, C, D, F} Roll two dice: (1,1), (1,2), (1,3), (1,4), (1,5), (1,6), (2,1), (2,2), (2,3), (2,4), (2,5), (2,6), (3,1), (3,2), (3,3), (3,4), (3,5), (3,6), (4,1), (4,2), (4,3), (4,4), (4,5), (4,6), (5,1), (5,2), (5,3), (5,4), (5,5), (5,6), (6,1), (6,2), (6,3), (6,4), (6,5), (6,6) Definition 2.1 A sample space S is a set that includes all possible outcomes for a random experiment listed in a mutually exclusive and exhaustive way. Mutually Exclusive means the outcomes of the set do not overlap. Exhaustive means the list contains all possible outcomes.
Events In an experiment, we are interested in a particular outcome or a subset of outcomes. Definition 2.2: An event is any subset of a sample space. For a die-rolling experiment, S={1,2,3,4,5,6}, A is the event of “ an even number”: A={2,4,6} B is the event of “an odd number”: B={1,3,5} C is the event of “greater than or equal to 5”: C={ 5, 6} D is the event of “less than 1”: D= Φ If a sample space has n elements, then there are 2n possible subsets. For example, if we have a sample space S={1,2,3}, then the possible events are Φ, {1}, {2}, {3}, {1,2}, {1,3}, {2,3}, S where we can say Φ is the impossible Event or null event and S is called sure event.
Event Operators and Venn Diagram There are three operators between events: Intersection: ∩ --- A∩B or AB – a new event consisting of common elements from A and B Union: U --- AUB – a new event consisting of all outcomes from A or B. Complement: ¯, A, -- a subset of all outcomes in S that are not in A. For sample space S, there are events A, B, and C, then the new events D=A∩C, E=B∩C, F=A ∩B, G=A∩B∩C Here G is a subset of either D, E, or F. The white area in S is the complement of AUBUC, denoted as AUBUC
Event Operators and Venn Diagram (Cont.) S S S AUB A∩B A Additional Operators Relative Complement B\A=A∩ B Symmetric Difference A∆B=(A\B) U (B\A)
Some Laws Commutative laws: Associate laws: Distributive laws: DeMorgan’s laws:
An Example If we have a sample space S={1, 2, 3, 4, 5, 6}, there are two events A={1, 2, 5}, B={2, 3, 4}, then A U B = {1, 2, 3, 4, 5} A ∩ B = {2} B = {1, 5, 6} A = {3, 4, 6} A \B = {1, 5} B\A = { 3, 4} A ∆ B = {1, 3, 4, 5} A U B =S\(A UB)= {6} A ∩ B = {6}
Example 2.2 After a hurricane, 50% of the residents in a particular Florida county were without electricity, 47% were without water and 38% were without telephone service. Although 20% of the residents had all three utilities, 10% were without all three, 12% were without electricity and water but still had a working telephone, and 4% were without electricity and working telephone but still had water. A county resident is randomly selected and whether or not the person was without water, electricity or telephone service after the hurricane is recorded. Express each of the following events in set notation and find the percentage of county residents represented by each. Q1: The selected county resident was without electricity only but had water and telephone service. Q2: The selected county resident was without only one of the utilities but had the other two. Q3: The selected county resident was without exactly two of the utilities. Q4: The selected county resident was without at least one of the utilities.
Solutions Sample Space: S={all residents in the particular Florida county} Determine the events based on the utilities: A={residents with electricity}, B={residents with water}, C={residents with phone service} Find useful information: A has 50%, B has 53% and C has 62%, A∩B∩C has 20%, AUBUC has 10%, A ∩ B ∩ C has 12%, A ∩ C ∩B has 4%. Q1: (B∩C)\A= B∩C∩A = A – AUBUC - A ∩ B ∩ C - A ∩ C ∩B has 24% Q2: (A∩B∩ C) U (A∩B∩ C) U (A∩B∩ C) has 24%+6%+5%=35% Q3: (A∩B∩ C) U (A∩B∩ C) U (A∩B∩ C) has 19%+12%+4%=35% Q4: AUBUC = A∩B∩C has 1-20%=80%