Download

1 / 41
410 likes | 455 Views
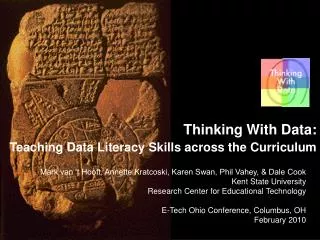
Using Technology to Think with Data across the Curriculum. Mark van ‘t Hooft, Karen Swan, & Annette Kratcoski Kent State University Research Center for Educational Technology eTech Ohio Conference, Columbus Ohio February 2008. Overview. Outline: Why Data Literacy? Project Background

E N D
Using Technology to Think with Data across the Curriculum Mark van ‘t Hooft, Karen Swan, & Annette Kratcoski Kent State University Research Center for Educational Technology eTech Ohio Conference, Columbus Ohio February 2008
Overview • Outline: • Why Data Literacy? • Project Background • Unit Background: Thinking with Data • Digital Tools and Thinking with Data • Combining Content and Tools This material is based upon work supported by the National Science Foundation under Grant No. ESI-0628122. Any opinions, findings, and conclusions or recommendations expressed in this material are those of the author(s) and do not necessarily reflect the views of the National Science Foundation.
Why Data Literacy? • “We use data every day—to choose medications or health practices, to decide on a place to live, or to make judgments about education policy and practice. The newspapers and TV news are full of data about nutrition, side effects of popular drugs, and polls for current elections. Surely there is valuable information here, but how do you judge the reliability of what you read, see, or hear? This is no trivial skill—and we are not preparing students to make these critical and subtle distinctions.” • -- Andee Rubin
Goals & Objectives • Develop a modular, interdisciplinary middle school unit, consisting of a series of four subject area modules that: • support deep student understanding of standards-based content & processes in four disciplines: Social Studies, Mathematics, Science, & English Language Arts. • use real-world data across the disciplines, allowing students to engage in key aspects of data literacy both within & across the disciplines. • are based on recent & robust findings in cognition & instruction, & specifically address the notion of transfer across the curriculum (PFL). • Integrate digital tools to support learning across modules. • Create a set of assessments that measure student growth in data literacy as well as unique disciplinary approaches to it.
preparation telling application communication English Language Arts Mathematics Social Studies Science Pedagogical Approach: PFL Preparation for Future Learning • preparingstudents to learn in one curricular context (SS), • with formal learning occurring in another (Math), & • extending the PFL approach to include application (Science) & • communication activities (ELA).
Fostering Data Literacy Across the Curriculum • Requires: • input from across the disciplines, allowing each teacher to remain a content expert • but not imposing responsibility for teaching a new discipline (data literacy) on teachers • Our approach: • Investigate a complex, engaging, real-world problem • Social studies sets the context • Math is used for quantitative analysis • Science investigates the context from a scientific perspective, building upon analyses conducted in math • ELA has students explore issues emerging from the data and communicate positions regarding these
Our Focus: Context through Social Studies Common types of data-based questions asked in social studies: • How can you compare the economies of France, China, and the U.S.? • What western country has the highest standard of living? • How can you determine an equitable distribution of water across Turkey, Syria, and Iraq? Commonalities • Requires comparisons across entities of wildly different sizes • Requires the creation and use of complex measures • Answers often take the form of proportional measures
Fairness: An Anchor for Making Comparisons Student notions of fairness are complex and context-dependent • Students look for fair processes • Students look for fair allocation/outcomes Fairness is a productive hook for moving students away from raw numbers, and to account for size of entities.
Math: How to Compare Such Entities Transform data to account for size Determine appropriate transformation Use proportional reasoning, specifically • Transform from raw data to normed data • Creation of unitizing measures, to allow comparison of any two similar entities Links with key ideas in middle school, including fairness (Social Studies and ELA), unit rate and scaling (math), and dilution (science).
Specifics of TWD’s Proportional Reasoning Per capita is used to: • Compare unlike entities (per capita water use) • Predict future states (if the population grows to x and per capita use remains the same, how much water will this country require?) Percent is used to: • Compare unlike entities (what country is more agricultural? More urban?) Dilution (ppm) is used to: • Compare against a standard (is this water source dangerous to drink?)
Technology and Data Literacy Knowing how to use digital and connected technology has become an ever-increasing part of being literate, as technology has become the “pen and paper of our time, … the lens through which we experience much of our world” -- Warlick, 2006 Large generalizations about ‘digital kids’ and their affinity for new styles of learning have a pernicious consequence – they can blind us to the actual literacy gaps that exist in children’s use of digital media. If using digital tools well actually places cognitive demands on children that they need help with, we’d better attend to and address them…. We are beginning to recognize that the literacy demands of common media tools vary according to the purpose to which they are put. --Tally, 2007
Use of Digital Technology in the Modules What we could/should use vs What the reality of school imposes How do we deal most effectively with this tension, without shortchanging learners? How much choice can/should we provide as part of the basic unit? Or should this just be a consideration for module extensions? What are the literacy demands that the use of digital technologies for learning puts on students?
Use of Digital Technology in the Modules Emphasis on simple tools (for a variety of reasons, including access and scalability)
Unit Context: World Water Issues Water Use in the Tigris-Euphrates Basin (SS, Math, Science) and in the United States (ELA)
Unit Context: World Water Issues "The Earth, with its diverse and abundant life forms, including over six billion humans, is facing a serious water crisis. All the signs suggest that it is getting worse and will continue to do so, unless corrective action is taken. The crisis is one of governance, essentially caused by the ways in which humans have mismanaged water.” -- World Water Development Report (United Nations, 2000)
Social Studies Purposes: • Create context for the water issue in the Middle East • Set students up for the math module (the ‘P’ in PFL) Big Ideas: • Water is an essential element of life, but distributed inequitably • Regional water issues transcend national boundaries • Context must be considered when studying an issue
Social Studies Data Literacy: • Understanding the relationship between data and context (being able to ask good questions) • Using appropriate data, tools, and representations (to create a data-based argument) • Understanding the relationship of claims to evidence (interpreting data-based arguments) Assessment: • Data-based briefing (text and graphs) • Water agreement • Individual written reflection
Social Studies Digital Tools: Web-based digital stories example
Social Studies Digital Tools: Spreadsheets to collect, manipulate, analyze, and draw conclusions from data.
Social Studies Digital Tools: Graphical representations of data to compare water access and use among countries
Social Studies Digital Tools: Word processing documents for answering questions, higher level thinking, simulation documents, and reflection
Mathematics Purposes: • Students learn key aspects of data literacy; e.g. the importance of proportional reasoning in “fairly” comparing entities of different sizes & dealing with very large numbers. • Students are set up to apply these understandings in science class. Big Ideas: • Many “real world” numbers are large beyond comprehension, but can be simplified by using representations and comparative measures. • “Equitable” situations do not mean exactly equal, but some important aspect of the situation (e.g. a proportional measure) should be nearly equal. • One can use proportional measures to predict possible future states.
Mathematics Data Literacy: • Students understand that there are instances in which data should be aggregated, summarized, etc. • Students recognize that data may be transformed to create a more useful measure • Students understand how data does (or does not) fairly describe a situation (including noticing that important data is missing) Assessment: • Pre- post-test of mathematical understanding • Formative assessments
Mathematics Digital Tools: Tinkerplots to explore scaling
Mathematics Digital Tools: Cubic meter animation
Science Purposes: • Students apply proportional reasoning to better understand important scientific concepts • Students understand that appropriate technology can help to solve important problems. Big Ideas: • The water cycle is a closed but dynamic system, resulting in a fluctuating geographic distribution of water • The water naturally entering a country is finite, so as population increases water availability per person decreases. • Humans can greatly impact the natural quality, flow, availability, and ecosystems of water.
Science Data Literacy: • Using data to construct and test explanations • Understanding that different types of representations are useful for different types of data Assessment: • Performance in a lab • Scoring students on the extent to which they draw reasonable conclusions based on supporting evidence from data • Scoring students on the extent to which they can convert data to enable fair comparisons across different cases/observations
Science Digital Tools: PowerPoint to present content for class discussion and individual/group work Comparison: Cleveland, OH: 48 cm
Science Digital Tools: Flash animations to explore changes in data over time.
English Language Arts Purposes: • Students will apply data representations to support persuasive arguments surrounding water-related issues • Students will communicate their findings using digital communications media Big Ideas: • Persuasive arguments consist of a position statement supported by arguments supported by evidence • In today’s world, persuasive presentations effectively integrate multiple media formats to fairly represent & communicate ideas • In today’s world, it is important to make sense of vast amounts of information in a variety of media formats
English Language Arts Data Literacy: • Understanding the relationship between data and context (being able to see patterns in data) • Using appropriate data, tools, and representations (to create a data-based argument) • Understanding the relationship of claims to evidence (developing fair representations of evidence in multiple media formats) Assessment: • Formative assessment • Rubric for final product
English Language Arts Digital Tools: Tools for publishing multimedia presentations (Word, PowerPoint, Excel) Work in progress …
Conclusions • Data literacy is a part of all aspects of our lives, including education. It is important to teach, but not easy to do. • Teaching it across the curriculum may help in this matter. • Integrating digital tools creates opportunities for rich experiences and data literacy (variety of resources; data manipulation in multiple formats; media creation). • Integrating digital tools creates challenges (students’ technology literacy levels).