Download
1 / 25
260 likes | 362 Views
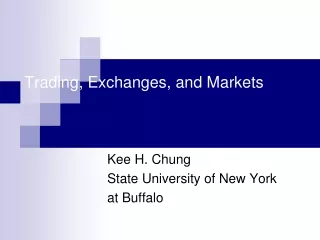
Price Generators and the Design of Trading Exchanges. by Mark Goetsch. Designing Trading Engines. The Pieces. Trading Lifecycle and Engines. Arbitrage. Quotes. Order Matching. STP. Working with Orders. Orderbook Analysis Pattern.

E N D
Price Generators and the Design of Trading Exchanges by Mark Goetsch
Designing Trading Engines The Pieces
Trading Lifecycle and Engines Arbitrage Quotes Order Matching STP
Orderbook Analysis Pattern “I enter orders[1] in an order book[2] for a specific market[3]. The orders are matched at discrete time time intervals that are controlled by a heartbeat[4]. The orders can be either buy[5] or sell[6] orders[1]. The order matcher will will check whenever a new order[1] is entered into the market. The time will be marked by the heartbeat[4]. If there is a match[7] then the order matcher will either fully match the order[8] or partially match the order[9].” Patterns Used • Orders • Orderbook • Market • Heartbeat • Buy Order • Sell Order • Match • Full Match • Partial Match
Order Book Reference Architecture Time Beat Buy Orders Sell Orders Orders Match Rules Invalid Order Match Partial Match Full Match
Gateway Analysis Pattern A customer authenticates[1] to a particular contract[2] which belongs to a market[3]. An order[5] is then presented to the orderbook[4] but not before checking the order[5] against the customers margin[6] which is different for every contract[2]. Patterns Used • Authenticate • Contract • Market • Orderbook • Order • Margin
Gateway(Router) Reference Architecture Order Authentication Margin Order Book Contract Market
Order Rules for Order Matchers Rules that are used for every matching possibility.
Types of Rules Opening Rules => How are orders entered before the opening Trading Rules => How are orders matched Closing Rules => How are orders handled at the end
A Rule from the Swiss Exchange “The incoming order is a limit order. It matches against the best limit in the book (bid price >= ask price) for the incoming limit order. The best limit in the book determines the price” Match buy quantity Buy Limit in book >= incoming sell Limit Remaining buy quantity Best Buy Limit Limit Order Against Limit Order Match sell quantity Sell Limit in book <= incoming buy Limit Remaining sell quantity Best Sell Limit
GLOBEX Opening (circa1992) Three Stages to Opening the Market • Staging Period – Orders are entered and a countdown begins which calculates the Indicative Opening Price (IOP) is possible (see table below). • Non-Cancel Period – Can enter new orders but not cancel orders. The final IOP is calculated. • Opening – Orders that can be matched are matched.
Order Matcher Front End Connectivity Trade Processing and Clearing CBOE Trade Match Firm Back Office Systems CBOEdirect API Confirm Record CMI CMTA/ Allocation FIX 4.2 OCC Trade Correction Order Matcher CME Clearing CME GLOBEX Trade Match CME GLOBEX API Ilink FIX 4.2 Confirm Record FIX 4.2 GUS/ Allocation FCM Back Office Systems FIX 2.3 Express Trade Correction
Testing the Trading Engines Knowing financial theory
How to Test the Engine Sample Buy and Sell Transactions Testing Engine Trading Engine Various prices above and below the book are generated according to a random distribution.
Video on Black Scholes https://www.khanacademy.org/economics-finance-domain/core-finance/derivative-securities/forward-futures-contracts/v/motivation-for-the-futures-exchange https://www.khanacademy.org/economics-finance-domain/core-finance/derivative-securities/Black-Scholes/v/introduction-to-the-black-scholes-formula
Simulating an Asset as a Random Walk (or drunkards walk) public static double SimulateAsset(double s0, double mu, double sigma,double tau, double delta_t,MCG g) { //Purpose: Simulates an Asset Price run using a random walk and returns a final asset price. // so = Price of the asset at time 0 (current time) // mu = Historical Mean // sigma = Historical Volatility (variance) // delta_t = period of time (% of a year or a day) // g = Random variable double s = s0; // Made the steps = to the number of days which is the same as daily changes. double nSteps =tau; for (int i=0; i < (int)nSteps; i++) { // s = s0 * (1 + mean + standard deviation * gaussian random number * squareRoot of the time period. s= s * (1 + mu * delta_t + sigma * g.gaussian() * Math.sqrt(delta_t)); } //Returns the final Price return s; }
Measuring the Volatility Associated with the Trade public static double MeasureVolatilityFromHistoric(double[] historic, double delta_t, int length) { // Purpose: Measures the Volatility for scaled prices. double sum = 0; double variance = 0; double volatility = 0; // length - 1 instead of length since n prices generates n-1 returns for (int i=0; i< length -1; i++) { //Random variable X^2 sum = sum + Math.pow((historic[i+1]-historic[i])/historic[i],2); } // E[X^2] - E[X]^2 variance = sum / (length -1) - Math.pow(MeasureMeanFromHistoric( historic, delta_t,length) * delta_t,2); // Volatility = SquareRoot(variance/ dt) which is the standard deviation scaled for a time increment volatility = Math.sqrt(variance/delta_t); return volatility; }
Measuring the averages public static double MeasureMeanFromHistoric(double[] historic, double delta_t, int length) { //Purpose: Measures the mean of the scaled prices. (Scaled indicates that the level of the // Prices is not important. double sum = 0; double average = 0; double waverage = 0; double returns = 0; //length-1 because the scaling requires n prices to generate a sequence of n-1 scaled returns. for (int i=0;i < (length-1); i++) { // Scales the returns and sums them returns = (historic[i+1]-historic[i])/historic[i]; sum = sum + returns; } //computes the average of the returns average = sum/(length-1); // divides the average by dt so that the average applies to each time increment waverage = average/delta_t; return waverage; }
Building Patterns Defining your engine
Financial Trading Patterns II “To understand the value of a contract, we need to understand the price of the goods being traded. Goods are often priced differently depending on whether they are bought or sold. This two-way pricing behavior can be captured by a quote[1]” Martin Fowler, Analysis Patterns 1997 Patterns Used • Quote Instrument, bid, offer, number, spread (bid-offer), mid (bid+offer / 2), one-way quote, two-way quote. Board Exercise
Financial Trading Patterns III “In volatile markets, prices can change rapidly. Traders need to value goods against a range of possible changes. The scenario[1] puts together a combination of conditions that can act as a single state for the market for valuation. Scenarios can be complex, and we need a way to define their construction so we can use the same scenario construction at different times in a consistent manner. Scenarios are useful for any domain with complex price changes.” Martin Fowler, Analysis Patterns 1997 Patterns Used • Scenario Instrument, Quote, Timepoint, Price, Quote, Party, Information Source, Market Indicator Board Exercise