Download
1 / 14
180 likes | 523 Views
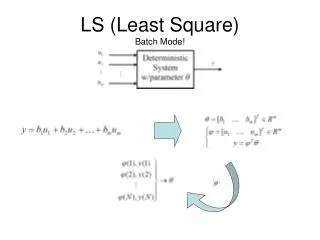
Trend Metode Least Square. Menggunakan nilai X Menggunakan nilai u. Menggunakan nilai X. Harga Beras di Pasar Bitingan Tahun 1967-1978. Y i = na + b X i Y i X i = a X i + b (X i ) 2. Y i = nilai deret berkala n = jumlah tahun

E N D
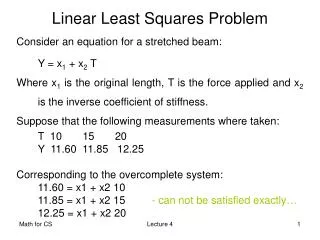
TrendMetode Least Square • Menggunakan nilai X • Menggunakan nilai u
Menggunakan nilai X Harga Beras di Pasar Bitingan Tahun 1967-1978
Yi = na + bXi Yi Xi = a Xi + b(Xi)2 Yi = nilai deret berkala n = jumlah tahun xi = periode waktu (tahun pertama dimulai dengan 0)
Yi = na + bXi Yi Xi = a Xi + b(Xi)2 X 11 X 2 219.014 = 12 a + 66 b 1.560.314 = 66 a + 506 b 2.409.154 = 132 a + 726 b 3.120.628 = 132 a + 1.012 b • 711.474 = - 286 b • b = 2.487,67 219.014 = 12 a + 66 b 219.014 = 12 a + 66 (2.487,67) 219.014 = 12 a + 164.186,22 12 a = 54.827,78 a = 4.568,98
a = 4.568,98 Y’ = a + bX b = 2.487,67 CONTOH 1. Berapa nilai trend pada tahun 1967? Jawab: Y’ = a + bX = 4.568,98 + (2.487,67) (0) = 4.568,98 + 0 = 4.568,98 2. Berapa Nilai trend pada tahun 1971? Jawab: Y’ = a + bX = 4.568,98 + (2.487,67) (4) = 4.568,98 + 9.950,68 = 14.519,66
Menggunakan nilai u(Data Genap) Harga Beras di Pasar Bitingan Tahun 1967-1978
Yi = nilai deret berkala n = jumlah tahun ui = periode waktu observasi ( u = 0) = setengah tahunan
a = 18.251,17 (nilai pada thn dasar 1972-1973) b = 1.243,84 Y’ = a + bu CONTOH 1. Berapa nilai trend pada tahun 1967 (30 Juni atau 1 Juli)? Jawab: Y’ = a + bu = 18.251,17 + (1.243,84) (-11) = 18.251,17 – 13.682,24 = 4.568,93
Menggunakan nilai u(Data Ganjil) Jumlah kayu yang dimuat di Pelabuhan Tanjung Mas Semarang tahun 1972 - 1978
Yi = nilai deret berkala n = jumlah tahun ui = periode waktu observasi ( u = 0)
a = 34.905 b = - 3.221,68 Y’ = a + bu CONTOH 1. Berapa nilai trend pada tahun 1972? Jawab: Y’ = a + b.u = 34.905 + (-3.221,68) (-3) = 34.905 + 9.665,04 = 44.540,04