Download
1 / 23
230 likes | 468 Views
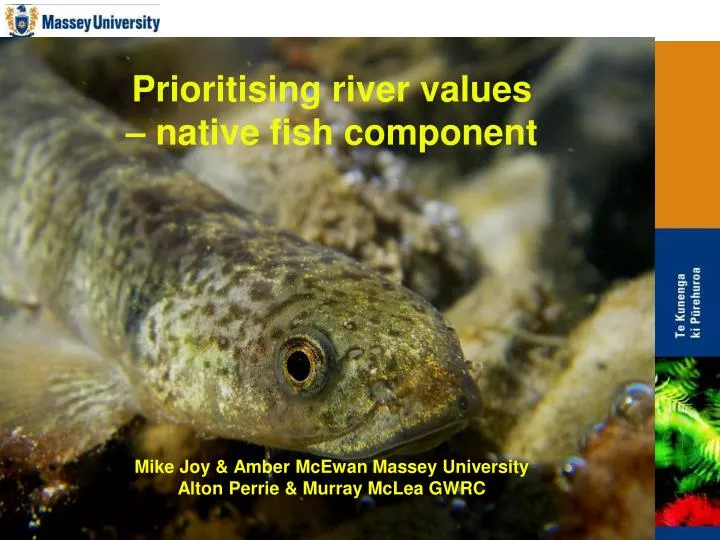
Prioritising river values – native fish component Mike Joy & Amber McEwan Massey University Alton Perrie & Murray McLea GWRC. Attribute 1: land use modification. Indicator: proportion of catchment in agricultural and urban land use. Indicator significance threshold:

E N D
Prioritising river values – native fish componentMike Joy & Amber McEwan Massey UniversityAlton Perrie & Murray McLea GWRC
Attribute 1: land use modification • Indicator: proportion of catchment in agricultural and urban land use. • Indicator significance threshold: • 3 = less than 30% modification • 2 = 30 – 50% modification • 1 =Greater than 50% modification • Data source: GIS – REC – FWENZ • Stream Habitat Assessment Protocols spreadsheets
Stream Habitat Assessment Protocols for wadeable rivers and streams of New Zealand Jon Harding, Joanne Clapcott, John Quinn, John Hayes, Mike Joy, Richard Storey, Hamish Greig, Joe Hay, Trevor James, Mary Beech, Rachael Ozane, Adrian Meredith, Ian Boothroyd Appendix for every river reach in New Zealand: info on catchment area, landcover,
Attribute 2: Barriers to migration Indicator: presence and severity of barrier(s), which includes taking into account the location (lower, mid, upper catchment) of the barrier within catchment and the severity of the barrier (i.e., excludes all species, some species, no species). And considers the cumulative effects of all barriers within a catchment. Thresholds: 3 = No barrier 2 = Barrier(s) present but having minimal impact on fish fauna e.g., barrier of low severity or if of high severity is located in upper reaches of catchment where it is unlikely to have much affect on the whole catchment. 1 = moderate barrier(s) located in lower or middles reaches of river having some impact on fish fauna. 0 = severe barrier(s) located in the lower or middle reaches of river and likely having a significant impact on fish fauna. Data source: GIS layers, Expert panel
Attribute 3: Flow Indicators: water – fish require water - Are low flows an issue and are they having no effect, some effect or a significant effect on the fish community. Thresholds: 3= Unlikely to be any impact on the fish community from low flows (either natural low flows or from abstraction pressure). 2= River doesn’t dry but is impacted by either natural low flows or abstractions and there is likely to be some impact on the fish fauna. 1= River (or reaches within) dry every year or extreme low flows that are likely to be having a significant impact on the fish fauna (can be both natural low flows or the result from abstraction pressure). Data source: Expert panel.
Attribute 4: Catchment size Indicator: Order and proportion of catchment with indigenous forest cover Thresholds: 2= 4th order or less that flows to the sea and/or >4th order as long as it > 50 % of indigenous forest in the catchment. 1= everything else. Data source: GIS...REC…FWENZ SHAP
Attribute 5: number of intolerant species present Description: Different native fish show different levels of tolerance to habitat modification and degradation. Presence of “intolerant” species can indicate the fish fauna is in a good state. Threshold: 3 = 4 or more 2 = 2 or 4 1 = 1 0 = 0 Data source: NZFFDB Or from predictive IBI average score for : Threshold: 3 = >40 2= 20 – 39 1 = 0-19 Data source predictive IBI Leathwick models
Attribute 6: Stronghold habitat for threatened species or maybe not a stronghold but considered to be of very important Description: Thresholds: 2 = Stronghold for threatened species. 1 = Not necessarily a “stronghold” (whatever that is?) but considered very important habitat/fish communities in the scheme of things,. 0 = none of the above. Data source: expert panel Or from predictive fish predictions the index of threatened species: Threshold: 3 = >26 2= 13 – 25 1 = 0-12 Data source predictive IBI Leathwick models, DOC threat rankings
New Zealand native fish What is different about NZ native fish? – (different from trout) They are mostly: • Cryptic/nocturnal • Benthic (no swim bladder) • Migratory (amphidromous) Implications – for prioritising rivers • Hard to sample • Incomplete data for country • Overriding influence of elevation/distance from coast on distributions so cant compare Problems for prioritising rivers = • Lack of data on un-sampled rivers • Inability to compare sites
New Zealand native fish Problem 1. Lack of data on un-sampled rivers; Solution = Predictive fish maps Joy, M. K. and R. G. Death. 2004. Predictive modelling and spatial mapping of freshwater fish and decapod assemblages using GIS and neural networks. Freshwater Biology 49:1036-1052. Leathwick, J. R., K. Julian, J. Elith, and D. Rowe. 2008. Predicting the distribution of freshwater fish species for all New Zealand's rivers and streams. NIWA Client Report HAM2008-005, National Institute of Water and Atmospheric Research LtD. Problem 2. Inability to compare sites Solution = Index of Biotic Integrity (IBI) (Joy, M. K. and R. G. Death. 2004. Application of the index of biotic integrity methodology to New Zealand freshwater fish communities. Environmental Management 34:415-428.)
Slope The New Zealand freshwater fish database ~ 25000 sites GIS data The REC & FWENZ
Defining the niche mathematically from the environmental variables for the fish species Temperature Native forest Slope Farming Rainfall Shade
AUCs for redfin bully ANN applied to each region individually using held out data • The AUC for all regions 0.90 0.84 0.76 0.94 0.88 0.91 0.84 0.91 • * 0.7 < AUC < 0.8: acceptable • * *0.8 < AUC < 0.9: excellent • *** AUC > 0.9: outstanding • Hosmer, D. W., and S. Lemeshow. 2000. Applied logistic regression 0.89
Temperature Native forest Predictive model Slope Farming Rainfall Shade Shortfin eel Probability of species occurring
New Zealand native fish Problem 1. Lack of data on un-sampled rivers; Solution = Predictive fish maps Joy, M. K. and R. G. Death. 2004. Predictive modelling and spatial mapping of freshwater fish and decapod assemblages using GIS and neural networks. Freshwater Biology 49:1036-1052. Leathwick, J. R., K. Julian, J. Elith, and D. Rowe. 2008. Predicting the distribution of freshwater fish species for all New Zealand's rivers and streams. NIWA Client Report HAM2008-005, National Institute of Water and Atmospheric Research LtD. Problem 2. Inability to compare sites Solution = Index of Biotic Integrity (IBI) (Joy, M. K. and R. G. Death. 2004. Application of the index of biotic integrity methodology to New Zealand freshwater fish communities. Environmental Management 34:415-428.)
Attributes considered but not included • Distance inland. • Altitude. • Local instream modification. • Water quality. • Relative abundance. • Taxonomic richness.
Recommendations: Need to use predictions and GIS data on rivers: (available to all RCs thorough SHAP and REC) • or miss vital information • allows no expert input • consistent results
Questions • What will this prioritisation be used for?