Download
1 / 20
210 likes | 319 Views
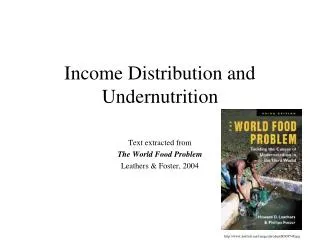
Income Distribution and Undernutrition. Text extracted from The World Food Problem Leathers & Foster, 2004. ttp://www.amazon.com/World-Food-Problem-Toward-Undernutrition/dp/1588266389. Poorest of the Poor. Live in third world Mostly landless Work for others, menial jobs Poorly educated

E N D
Income Distribution and Undernutrition Text extracted from The World Food Problem Leathers & Foster, 2004 ttp://www.amazon.com/World-Food-Problem-Toward-Undernutrition/dp/1588266389
Poorest of the Poor • Live in third world • Mostly landless • Work for others, menial jobs • Poorly educated • Illiterate • Superstitious • Squatters who live in huts • Almost no food • Fragmented household • Debt to relatives or lenders http://archives.zinester.com/60514/143124/232308_slum.JPG
Per capita incomes differ • Democratic Republic Congo: $80/yr • Switzerland: $38,330 • Average person in Switzerland makes 500X more than in Mozambique. • If compute purchasing power parity, difference between richest and poorest countries is 80X http://faculty.washington.edu/wgold/family%20on%20crinnenhorn.jpg http://news.bbc.co.uk/media/images/38542000/jpg/_38542715_family300bbc.jpg
Purchasing Power Parity 2003 http://en.wikipedia.org/wiki/File:PPP2003.svg
Human Development Index • Measures quality of life • High HDI • High income countries • Low HDI • Low income countries • HDI not perfectly correlated with income http://bp0.blogger.com/_vxI-ox6Dacw/R0yJQ0c_8YI/AAAAAAAAAO4/jCG1CPQfBb0/s1600-h/HDI+map.JPG
Gini Coefficient • Gini coefficient: • Based on area of crescent made by Lorenz curve • measures inequity of wealth • = A/A+B • Gini index = Gini coefficient x 100 • Lowest inequity is in Japan • Gini coefficient = .249 • Gini index = 24.9 • Richest 20% controls 35% of income • Highest inequity is in Brazil • Gini index= 60.7 • Richest 20% controls 64% of income
Global Gini Coefficients http://upload.wikimedia.org/wikipedia/commons/thumb/a/aa/Gini_Coefficient_World_Human_Development_Report_2007-2008.png/800px-Gini_Coefficient_World_Human_Development_Report_2007-2008.png
Kuznets Curve • As a country develops, rich must get richer first • Therefore inequity will increase initially • Later, inequity will drop as prosperity increases Data from 75 countries
Wealthy out-compete poor for food • Can outbid poor for food • Also purchase more livestock • Herd becomes more dependent on grain • Price of grain is bid up • Harder for the poor to buy grain
Overall inequity declining slowly • Global Gini coefficients: • .67 in 1980 • .65 in 1990 • .63 in 2000 • .62 in 2005 (Bob Sutcliff, 2007) http://www.bbc.co.uk/radio4/today/gallery/media/poverty2.jpg
Child Labor • 250 million children work worldwide • 22% of workforce in Asia • 17% of workforce in Latin America • 1/3 of children in sub-Saharan Africa • Jobs • Agriculture • Textiles • Maids and services • Construction and manufacturing • Prostitution • Many sold into debt bondage • To pay parent’s debt or as collateral • Advance on wages http://uzbekistan.neweurasia.net/wp-content/images/june-2007/01_02a.jpg
U.S. Poor are Wealthy • Poverty income • $9,359/yr • Person at poverty line in U.S. • has higher income than 80% of people in the world • 97% poor households in U.S. have color TV
Middle Class Decline • Middle class is disappearing in U.S. • Income gap is increasing between wealthy and poor.
U.S. Inequity increasing • Gini coefficients: • 1968: 38.6: • 1970: 39.4 • 1980: 40.3 • 1990: 42.2 • 2000: 46.2 • 2007: 47.0 http://www.visualizingeconomics.com/wp-content/uploads/us_income_inequal_5_15_2006.jpg
Rich in U.S. getting richer http://online.wsj.com/public/resources/images/P1-AL265_COMPAR_20080420183003.gif
Hunger in the U.S.A. • 36.3 million people live in households that experience hunger • or the risk of hunger • Includes 13 million children • More than one in ten households in the United States (11.2 percent). • 1/5 of U.S. food ends up in the landfill • Source: Bread for the World Institute (2004) http://www.endhunger.org/images/u_s_hunger.png
http://www.bendib.com/newones/2006/november/large/End%20of%20Hunger%20in%20US.jpghttp://www.bendib.com/newones/2006/november/large/End%20of%20Hunger%20in%20US.jpg