Download
1 / 19
190 likes | 310 Views
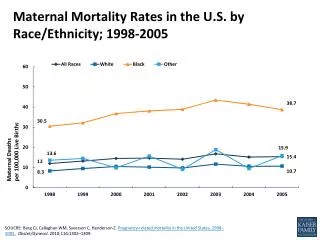
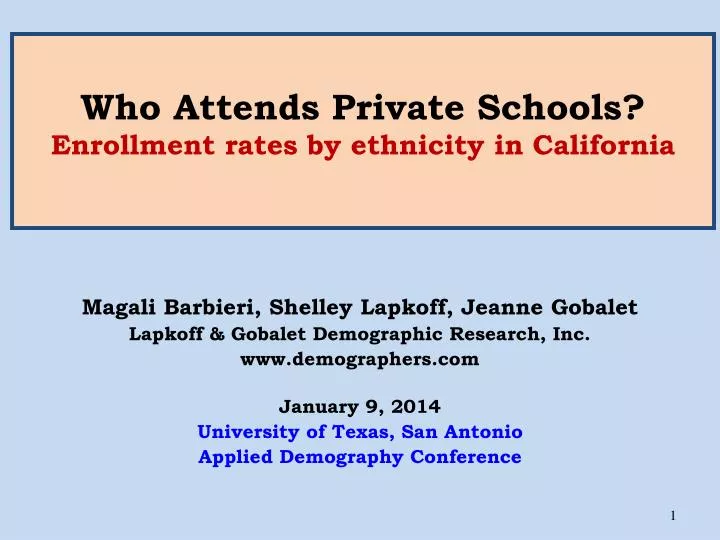
Who Attends Private Schools? Enrollment rates by ethnicity in California. Magali Barbieri , Shelley Lapkoff, Jeanne Gobalet Lapkoff & Gobalet Demographic Research, Inc. www.demographers.com January 9, 2014 University of Texas, San Antonio Applied Demography Conference.

E N D
Who Attends Private Schools?Enrollment rates by ethnicity in California MagaliBarbieri, Shelley Lapkoff, Jeanne Gobalet Lapkoff & Gobalet Demographic Research, Inc. www.demographers.com January 9, 2014 University of Texas, San Antonio Applied Demography Conference
Public school districts are interested in local private school enrollment rates This is because: • Changes in private school enrollments often result in changes in public school enrollments • Transfers between public and private schools can explain oddities in grade progression patterns (such as many more 9th graders than 8th graders the year before) • Private school rates can indicate how the public school district is perceived
Two sources of data on private school enrollments • Administrative data from the private schools, reported to state agencies, but • Students may live outside the public school district boundaries in which the private school is located • Poor reporting, at least in California, since there is no penalty for misreporting or not reporting • Census and survey data • 2000 Census long form SF3 • American Community Survey
California and two of its Counties San Francisco, CA (city/county/school district) Fresno, CA (county, city) • Studied using PUMS data from the 2007-2011 American Community Survey • Descriptive statistics + logistic regression analysis • Geographic units: counties and PUMAs within each county
San Francisco and Fresno’s K-12 private enrollment rates couldn’t be more different
Yet in both counties, and in the state, private school enrollment rates vary By: • Race/ethnicity • Household income • Other socioeconomic measures • School level (kindergarten, elementary, middle, high) • Location of school district But how much do they vary, and which factors matter most? Do the effects differ by area?
African Americans have relativelyhigher rates in Fresno than in San Francisco
San Francisco has an unusual pattern: students in the lowest quartile of household income have higher rates than those in the 2nd quartile Private school scholarships?
San Francisco and Fresno have different patterns of private school enrollment by grade level Different perceptions of desirability of public and private schools for each school level?
Private school enrollment rates vary by geographical subarea (PUMA) – San Francisco
Private school enrollment rates vary by geographical subarea (PUMA) – Fresno County
Multivariate regression analysis To understand the geographical difference in private school enrollment patterns, it is necessary to: • control for correlations among the variables • measure differences in the impact of each factor on private school rates in Fresno, San Francisco and the whole of California Statistical strategy = one big logistic regression model with interactions
Logistic regression on the odds of attending private school (with interactions)for all K-12 Students in California 2007-11 ACS
To convert odds into probabilities : the formula is • p = odds/(1+odds) • The probability of attending private school for a student in California with all the reference characteristics (white, born in the US, male, living with both parents in a single family home, in the poorest income quartile but not receiving food stamps) is 0.101/(1+0.101) = 0.09207, • or about 9.2%.
The odds are the result of the multiplication of the constant by the odds ratio for each relevant variable. If the student has all the baseline characteristics but lives in Fresno PUMA 3401, his probability of attending private school is (0.101*0.474)/(1+(0.101*0.474))=0.04585 or about 4.6%
For example, the probability of an Hispanic girl attending a private school: • (1) If she lives in California but in neither Fresno or San Francisco is: (0.101*0.448*1.067)/(1+(0.101*0.448*1.067)) = 4.6% • (2) If she lives in Fresno PUMA 3301, 3302, or 3402, her probability is the same as in (1) because the coefficients for these Fresno PUMAs and for being a girl in Fresno and being Hispanic in Fresno (which are equal to 0.900 and 0.985, respectively, for the last two) are not significant. • (3) If she lives in Fresno PUMA 3401 , the probability is: (0.101*0.448*1.067*0.474)/(1+(0.101*0.448*1.067*0.474)) = 2.3% • (4) If she lives in San Francisco PUMA 2207 (here we need to include both the coefficient for San Francisco PUMA 2207 and the coefficients for female and Hispanic because these are significant), the probability is: (0.101*0.448*1.067*1.395*0.814*3.053)/(1+(0.101*0.448*1.067*1.395*0.814*3.053)) = 14.4%
Main results (1) Overall, largest differences are due to: • place of residence (San Francisco vs. rest of California) • wealth (income and food stamps) • race and ethnicity (Hispanics vs. Whites)
Main results (2) Geographic variations in the impact of some explanatory variables: • Race and ethnicity (differ from statewide patterns in Fresno and San Francisco – especially for African Americans) • Income (smaller in Fresno) • Housing type (smaller in San Francisco)
Conclusions: • Household income has the largest effect on private school enrollment rates. • Whites have higher rates of private school enrollment, even after controlling for income. • Hispanics have the lowest rates statewide but not in Fresno or San Francisco, where African Americans rank lowest. • Race/ethnicity and household income are strong variables in both cities. • San Francisco has a “culture” of private schooling; even the poorest households in the city have private school enrollment rates 3 to 11 times higher than elsewhere. Jeanne Gobalet gobalet@demographers.com Lapkoff & Gobalet Demographic Research, Inc. www.demographers.com