Download
1 / 88
890 likes | 1.05k Views
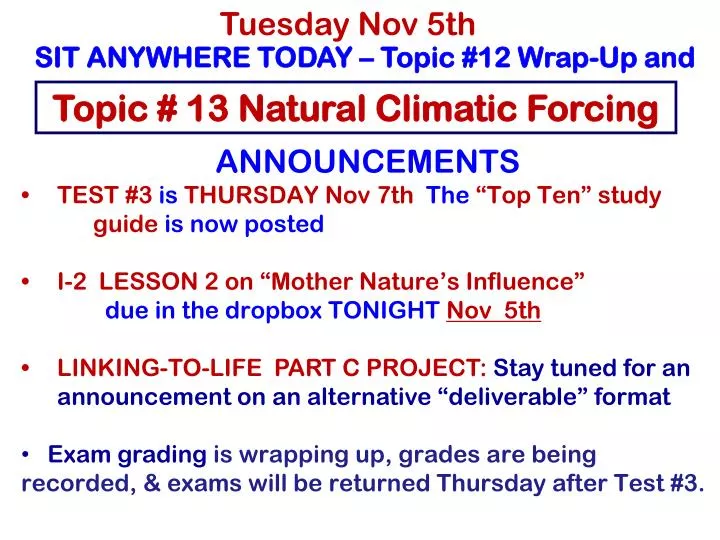
Tuesday Nov 5th. SIT ANYWHERE TODAY – Topic #12 Wrap-Up and . Topic # 13 Natural Climatic Forcing. ANNOUNCEMENTS TEST #3 is THURSDAY Nov 7th The “Top Ten” study guide is now posted I-2 LESSON 2 on “Mother Nature’s Influence” due in the dropbox TONIGHT Nov 5th

E N D
Tuesday Nov 5th SIT ANYWHERE TODAY – Topic #12 Wrap-Up and Topic # 13 Natural Climatic Forcing • ANNOUNCEMENTS • TEST #3 is THURSDAY Nov 7th The “Top Ten” study guide is now posted • I-2 LESSON 2 on “Mother Nature’s Influence”due in the dropbox TONIGHT Nov 5th • LINKING-TO-LIFE PART C PROJECT: Stay tuned for an announcement on an alternative “deliverable” format • Exam grading is wrapping up, grades are being recorded, & exams will be returned Thursday after Test #3.
WRAP UP of PREVIOUS TOPICS . . . .
5. + together = the Greenhouse Effect 3. 2. 1. gases of atmosphere scatter shorter blue wavelengths 4. Noon: more & dusk: more The LEFT side of the equation:
6. (dust, thicker atmosphere scatters longer red/orange wavelengths) 7. radiates day & night; camera senses IR 9. leads to distinct shadows, while diffuse SW radiation does not 8.
10. All wavelengths of visible part of spectrum are scattered & transmitted in a colored spectrum by raindrops 12. More is absorbed, leads to more which can then warm up car 11. Attempt to increase absorption & reduce into eyes; reduces glare
LE H 14. Wet mud evaporates from pig & cools him: also heat from pig’s body is conducted into soil: 13. Hot air (less dense than surroundingcool air) rises in a convection current & lifts balloon G 15. June is hot & dry in Tucson. Dry, hot air can “hold” more water vapor, so water in cooler pads is evaporated easily. Hence more energy goes into instead of This cools the house! LE H The RIGHT Side of the Equation:
BONUS POINT CHALLENGE WRAP UP NOW – on the back of the paper, in your group, complete the feedback loop on page 65 by linking the components with the proper coupling arrow symbols as used in the SGC text p 65
albedo START HERE SW radiation absorbed Extent of ice cover Amount of melting Ocean temperature
The ANSWER! albedo - + SW radiation absorbed Extent of ice cover + - + Amount of melting + Ocean temperature
TOPIC #12 Wrap Up on GLOBAL CLIMATE PATTERNS
Ultimate source of energy is the SUN (SW) LW energy is radiated in & out by EARTH & Atmosphere Any NET (leftover) energy Goes into the HEAT TRANSFER processes that drive WEATHER & CLIMATE ! Review
Earth-Sun Relationships (Astronomical Forcing): Review This determines the LATITUDAL & SEASONALDIFFERENCES of what comes INfrom the SUN and is absorbed . . . . . at each latitude To WARM the Earth
Earth + AtmosphereTemperature & the Greenhouse Effect This determines the LATITUDINAL & SEASONAL DIFFERENCES of what goes OUT from the EARTH . . . . . at each latitude To COOL the Earth
Put them together . . . . B A p 69
ENERGY BALANCE & CLIMATE REGIONS (wrap up) Tropics Sub-tropics Sub-tropics Extra- tropics Extra- tropics Polar Polar Global climate patterns are determined (in part) by regions of surplus and deficit in the ENERGY BALANCE
POLE EQUATOR POLE Now lets look at a Pole to Pole Transect
ROSSBY WAVES COOLER MIDDLE LATITUDES HADLEY CELLS WARM TROPICAL LATITUDES COOLER MIDDLE LATITUDES ROSSBY WAVES
Both ATMOSPHERE & OCEAN play important roles in BALANCING OUT ENERGY SURPLUS & DEFICIT AREAS: ATMOSPHERE more important in mid high latitudes OCEAN transports MOST of the energy in LOW subtropical latitudes Poleward transport of energy in N.H. P 71
Energy is transported from areas of surplus to deficit via:H (sensible heat) &LE (Latent Energy) p 70
To ponder . . . . p 73
TOPIC #13 NATURAL CLIMATIC FORCING
Global climate variability and change are caused by changes in the ENERGY BALANCE that are “FORCED” CURVE ACURVE B is B A Curve A orCurve B can move Up or Down due to a radiative forcing in SW or LW
FORCING = a persistent disturbance of a system Human - caused (a longer term disturbance than a perturbation)
NATURAL CLIMATIC FORCING vs. ANTHROPOGENICFORCING
Natural Climatic Forcing = changes due to natural earth-atmosphere-sun processes • Earth-Sun orbital relationships • Solar variability • Changing land-sea distribution (over long time scales: due to plate tectonics) • Volcanic eruptionsalso: internal atmosphere-ocean variability (i.e., El Nino & La Nina),clouds, dust, etc p 73
Anthropogenic Climatic Forcing = changes due to human causes or enhancement of the processes involved • Enhanced Greenhouse Effect due to fossil fuel burning • Land use changes due to human activity (deforestation, urbanization, etc.) • Soot and aerosols from industry • Chemical reactions in stratosphere involving human-made compounds (ozone depletion) p 73
All things are connected. Whatever befalls the earth, befalls the children of the earth. ~ Chief Seattle p 75
The 3 main drivers ofNATURAL CLIMATIC FORCING: • ASTRONOMICAL FORCING • SOLAR FORCING • VOLCANIC FORCING
The 3 main drivers ofNATURAL CLIMATIC FORCING: • ASTRONOMICAL FORCING • SOLAR FORCING • VOLCANIC FORCING
Changes in Solar “Astronomical” Forcing have driven natural climate variability(ice ages, etc.) on LONG time scales (5,000 to 1 million years) What has varied over time? #1 OBLIQUITY OF EARTH’S AXIS #2 ECCENTRICITY OF EARTH’S ORBIT # 3 Timing of Seasons in Relation to Orbit:“PRECESSION OF THE EQUINOXES” p 75
Q1. What is being represented by this diagram ? • 1 - One of the Equinoxes, where every latitude on Earth experiences 12 hours of daylight and 12 hours of darkness. • 2 - Northern Hemisphere winter. • 3 -Northern Hemisphere summer.
Q1. What is being represented by this diagram ? • 1 - One of the Equinoxes, where every latitude on Earth experiences 12 hours of daylight and 12 hours of darkness. • 2 - Northern Hemisphere winter. • 3 -Northern Hemisphere summer.
1. OBLIQUITY OF EARTH’S AXIS axis “tilts” 23.5 degrees from plane of ecliptic causes the seasons has varied in the past from more “tilted” to more “vertical” (~24.5 º to ~ 22.5 º) p 75
Q1 How do you think global climate would change with less of a tilt? 1 – The difference in annual temperature between polar and tropical latitudes would be GREATER 2 – The difference in annual temperature between polar and tropical latitudes would be LESS
Q1 How do you think global climate would change with less of a tilt? 1 – The difference in annual temperature between polar and tropical latitudes would be GREATER 2 – The difference in annual temperature between polar and tropical latitudes would be LESS
2. ECCENTRICITY OF ORBIT Earth’s orbit around sun is not symmetrical Has varied in the past from more circular => elliptical shape (more “eccentric!”) p 75
3. PRECESSION OF THE EQUINOXES (Timing of Seasons in Relation to Orbit) Currently the Earth is closest to the Sun (perihelion) in Jan & farthest (aphelion) in July. This has varied in the past. p 75
the Future TODAY the Past (in thousands of years) Timing of N.H. summer season & perihelion degree of axis tilt shape of orbit elliptical circular p 75
Summarizing graph of SOLAR INSOLATION calculated for 65 o N latitude from the present to 1 million years ago based on “ASTRONOMICAL CLIMATE FORCING” 9,000 years ago ( 9 ka) Ka = thousands of years ago TODAY p 76 Time PRESENT 1 MILLION YEARS AGO In the Northern Hemisphere, peak summer insolationoccurred about 9,000 years ago when the last of the large ice sheets melted. Since then N. H. summers have seen LESS solar radiation.
Mid-Holocene warm period (~ 6,000 years ago) Global warming “deniers” often point out how warm Greenland was in the past : Generally warmer than today, but only in summer and only in the northern hemisphere. Cause = “astronomical climate forcing” Top p 76
Other notable “naturally forced” climate changes of the more recent past: Medieval Warm Period (MWP) “Medieval Climatic Optimum”9th-14th centuries (800-1300) (regionally most evident in Europe) Little Ice Age (LIA)15th – 19th centuries (1400-1800) esp. 1600 -1800 (evidence found globally) 1850 1966 MedievalClimatic Optimum Fig 15-1c in SGC Little Ice Age The “Little Ice Age” (LIA)
The 3 main drivers ofNATURAL CLIMATIC FORCING: • ASTRONOMICAL FORCING • SOLAR FORCING • VOLCANIC FORCING
ANOTHER POSSIBLE NATURAL FORCING: SOLAR VARIABILITY Sunspot maxima = MORE solar brightness (warmer temps) Sunspot minima = LESS solar brightness (cooler temps) p 76
ANOTHER POSSIBLE NATURAL FORCING: SOLAR VARIABILITY MAX MIN • Q2 – During SUNSPOT Maximum periods: • 1. The sun is darker so it gives off less energy and global cooling is likely. • The sun sunspots indicate active solar flares and the sun gives off more energy leading to warmer periods. • There is no link between solar activity and global warming. p 76
ANOTHER POSSIBLE NATURAL FORCING: SOLAR VARIABILITY MAX MIN • Q2 – During SUNSPOT Maximum periods: • 1. The sun is darker so it gives off less energy and global cooling is likely. • The sun sunspots indicate active solar flares and the sun gives off more energy leading to warmer periods. • There is no link between solar activity and global warming. p 76
ANOTHER POSSIBLE NATURAL FORCING: SOLAR VARIABILITY Sun’s output isnot constant: SUNSPOT CYCLE Has decreased since 1980 http://www.sidc.be/sunspot-index-graphics/sidc_graphics.php Sunspot maxima = MORE solar brightness (warmer temps) Sunspot minima = LESS solar brightness (cooler temps) p 76
Maunder Minimum (cooler) (1645 -1715) linked to “Little Ice Age” (1600-1800) But uncertainties remain! What’s the MECHANISM that links the Sun’s drop in brightness to the lower temperatures on the Earth? Dalton Minimum (1795 – 1825) -- was also cooler -- BUT, lots of large volcanic eruptions then too Since the Dalton Minimum, the Sun has gradually brightened , e.g., “Modern Maximum” ( in 2001) p 76
BUT . . .The increase in solar brightness during the recent “Modern Maximum” accounted for only: • about ½ of the temperature increase since 1860, and • less than 1/3 since 1970 • The rest is attributed to greenhouse-effect warming by most experts in solar forcing. p 76