Download
1 / 19
190 likes | 281 Views
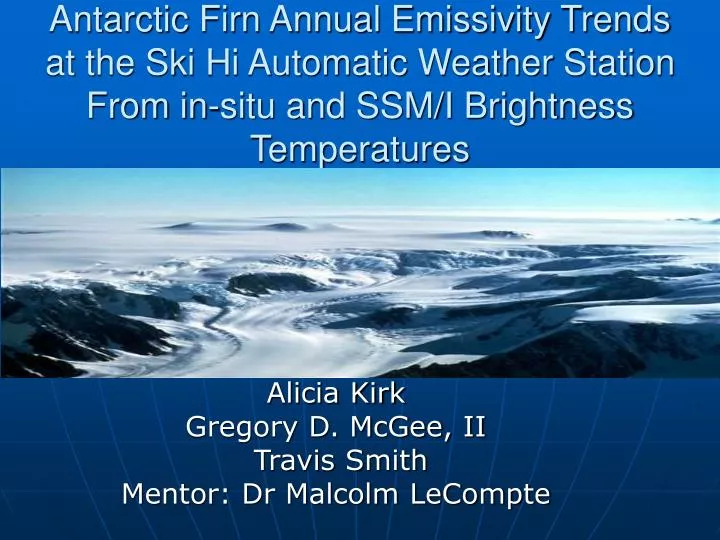
Antarctic Firn Annual Emissivity Trends at the Ski Hi Automatic Weather Station From in-situ and SSM/I Brightness Temperatures. Alicia Kirk Gregory D. McGee, II Travis Smith Mentor: Dr Malcolm LeCompte. Introduction. Alicia Kirk, Fayetteville State University,

E N D
Antarctic Firn Annual Emissivity Trends at the Ski Hi Automatic Weather Station From in-situ and SSM/I Brightness Temperatures Alicia Kirk Gregory D. McGee, II Travis Smith Mentor: Dr Malcolm LeCompte
Introduction • Alicia Kirk, Fayetteville State University, • Gregory D. McGee, II, Mississippi Valley State University, • Travis Smith, Elizabeth City State University • Mentor: Dr Malcolm LeCompte
Overview • Emissivity Trends at the Ski Hi Automatic Weather Station from in-situ and SSM/I Brightness Temperatures • Data and Methods • Results • Conclusion • Future Research
Purpose • Determine emissivity trends at Ski Hi for 1994 to 1998. • Calculating the emissivity data for gaps in data.
Abstract • Firn is compacted, near-surface snow persisting longer than one season but not yet compressed into glacial ice. Knowledge of firn surface temperature (TS) trends across the Antarctic ice sheet is useful for documenting and quantifying change and providing a temporal and spatial context for measurements made during the Antarctic International Polar Year (IPY): 2007-2009. Automatic Weather Stations (AWS) provide intermittent daily near-surface temperatures (TAWS, ≈ TS) at a limited number of sites on the Antarctic ice sheet, while satellite passive microwave radiometers aboard the Defense Meteorology Satellite Program (DMSP) Special Sensor Microwave Imager (SSM/I) obtain a nearly continuous daily record of surface brightness temperature (TB) across the entire continent. The Rayleigh-Jeans Approximation suggests that, TB should be very nearly equal to the product of the surface emissivity (ε) with the actual surface temperature, (TS) although the actual magnitude of ε is uncertain.
Abstract (cont…) • The ratio of spatially and temporally coincident TB and TAWS yields an estimate of ε at a specific time and place and can be used to extrapolate TS trends across temporal and spatial gaps in the limited AWS record. The spatial and temporal variability of firn emissivity is not well understood but known to be much less variable than daily TS. Tabulating continuous daily ratios of TB/TAWS yields an approximate firn ε trend from which TS data gaps can be filled from TB data or vice versa. A least squares technique will be used to derive an analytic function providing ε variation with Julian date.
Objective • The ECSU summer 2007 URE Antarctic Temperature Mapping Team will create an analytic model of annual emissivity (ε) at the Ski Hi AWS from 1994-1998 using previously compiled satellite and in-situ AWS temperature records and satellite microwave brightness temperatures. Time permitting, Ski Hi ε trends will be compared with ε trends derived at selected stations on the West Antarctic Ice Sheet (WAIS) bordering an interior region without AWS coverage. The other AWS stations whose temperature records could provide the basis for calculating emissivity trends are: Brianna (1994-1997), Byrd (1981-99), Elizabeth (1996-99), Erin (1996-99), Patrick (1986-91), Swithenbank (1998-99), and Theresa (1994-99). • (AWS temperatures were obtained from the AWS Project data archive at the University of Wisconsin’s Space Science and Engineering Center (SSEC). Values of TB (1994-1998) for the Ski Hi site were obtained from Dr. Chris Schuman at NASA Goddard Space Flight Center.) • Future work will use AWS and SSM/I TB data to establish continuous emissivity and TS trends at other AWS and across spatial and temporal data gaps. The 2007 URE work is thus a necessary intermediate step toward deriving surface temperature trends across the entire Antarctic ice sheet over the last 28 years.
Tools • Microsoft Excel • World Wide Web • Microsoft Word • TI-84 Plus • Ski Hi AWS Data
Results • 0.899+0.4904*SIN(x*2.33*PI()/365-(0.61*PI())) • We were able to fill in the gaps of the temperatures that were not recorded because of the satellite failure.
Conclusion • At the end of the session we completed the input and manipulation of the data sets years of 1994 to 1998. • In order to get temperatures for each year, we had to adjust amplitude, frequency, phase change and y intercept, also known as the offset of the equation. They were adjusted to achieve the lowest possible Chi squared value so that a new equation could be created and the temperatures that were not recorded by Automated Weather Stations could be completed from that equation. • Graphs were made to show the change in temperatures for each year and in correspondence to the emissivity for each year.
Future Research • The continuation of this project would use the SSM/I - AWS temperature ratios to construct the emissivity trends and complete the missing data points within the record. • The future team will have to choose what time frame to begin the projection, since the projection maps will have to be produced on a daily or weekly basis. However, once a template for this process has been established the time frame for creating the projection maps should be substantially shortened. • Since Only one weather station was used. To get the most accurate data, weather stations Noel and Theresa will need to be included.
Acknowledgements • Dr. Linda Hayden; Principal Investigator and Director of CERSER • Dr. Malcolm LeCompte; Mentor • Mr. Jeff Wood
References Shuman et al (2000): An Empirical Technique for Estimating Near Surface Temperature Trends in Central Greenland from SSM/I Brightness Temperatures: Remote Sensing of the Environment, 51, pp. 245-253, 1995 Center or Remote Sensing of Ice Sheets (CReSIS) 2006 Retrieved from http://www.cresis.ku.edu/ on the date of February 25, 2007 Estimating Firn Emissivity, from 1994 to1998, at the Ski Hi Automatic Weather Station on the West Antarctic Ice Sheet Using Passive Microwave Data; TreAsia Fields Jerome Mitchell Demetrus Rorie; ECSU Undergraduate Reasearch 2006