Download
1 / 28
280 likes | 476 Views
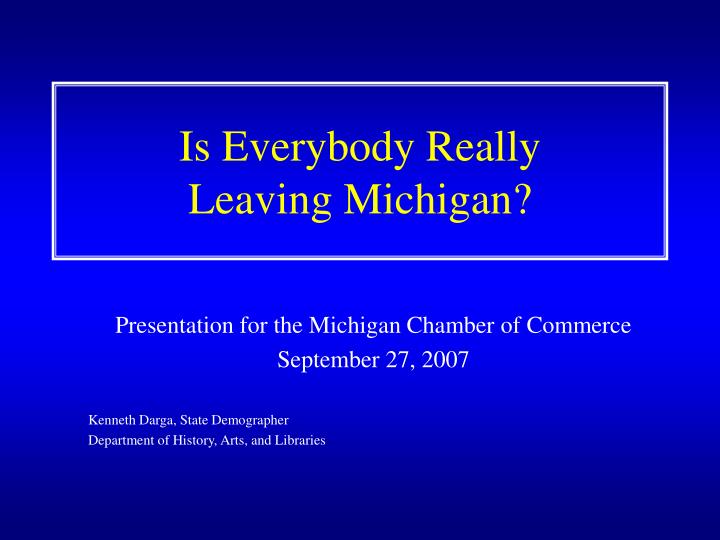
Is Everybody Really Leaving Michigan?. Presentation for the Michigan Chamber of Commerce September 27, 2007 Kenneth Darga, State Demographer Department of History, Arts, and Libraries. Michigan’s migration patterns have some negative aspects and some positive aspects.

E N D
Is Everybody Really Leaving Michigan? • Presentation for the Michigan Chamber of Commerce • September 27, 2007 • Kenneth Darga, State Demographer • Department of History, Arts, and Libraries
Michigan’s migration patterns have some negative aspects and some positive aspects. • The negative aspects of Michigan’s migration patterns are often overstated. • The positive aspects are often overlooked.
The Bad News: • The number of people moving out of Michigan is larger than the number of people moving into Michigan.
Domestic Migration Ratios ( OUT : IN ) • 66 : 34 United Van Lines • 58 : 42 Internal Revenue Service • 58 : 42 American Community Survey • 66 : 34 ACS (age 55-64) • 52 : 48 ACS (age 27-34)
Six Lowest Rates of Out-Migration in the U.S. for 2004-05 • 1.8% Texas • 1.8% Wisconsin • 1.8% Pennsylvania • 1.9% Michigan • 2.0% Ohio • 2.1% California
7 of the 11 lowest rates of out-migration in 2005 were in Great Lakes states.
Michigan had the nation’s lowest rate of out-migraton in 2000, 2002, 2003, and 2004
In 2005, Michigan had the nation’s second lowest rate of outmigration (behind Texas) for persons age 27-34
Rankings of Michigan’s Out-Migration Rates by Age, 2000-05 • Age 1 – 5 #1 Age 35 – 44 #1 • Age 6 – 12 #2 Age 45 – 54 #6 • Age13 – 17 #1 Age 55 – 54 #12 • Age 18 – 21 #3 Age 55 – 64 #29 • Age 22 – 26 #3 Age 65 – 74 #19 • Age 27 – 34 #1
The only states with lower domestic in-migration than Michigan are New York and California.
Out-Migration Rates for Labor Force Participants Age 22-34, 2000-2005 Mich.U.S. No Degree 2.1% 3.5% Associate’s Degree 1.5% 3.8% Bachelor’s Degree 5.8% 7.0% Master’s Degree 5.8% 7.7% Professional Degree 6.1% 8.8% Doctoral Degree 9.2% 13.3% All Levels of Education 3.1% 4.6% All Degrees 4.9% 6.5% Bachelor’s and Higher 5.9% 7.3%
Estimated Average Migration Flows, 2000-2005 College graduates age 22-34 in labor force: • 24,248 out-flow to other states • 24,897 in-flow from other states • 4,616 in-flow from other countries • 49 : 51 ratio of domestic out-movers to domestic in-movers
Our recent unemployment statistics have negative aspects, but those aspects are often overstated. • Positive aspects of our recent unemployment statistics are often overlooked.
Michigan’s estimated unemployment rate in 2006 was 6.9%. • The average from 1976 to 2006 is just over 7.9%.
WV AK MI LA OR MS NJ NE HI IA MN NH ND OK SD WY
State Unemployment Rates in 2006Relative to Michigan # of States % of Pop. Within 2 pct-pt: 16 40% Including: Ohio, Indiana, Texas, and California Within 3 pct-pt: 35 81% Including: Wisconsin, Illinois, Minnesota, New York, North Carolina, Georgia
Overlooked aspects of Michigan’s unemployment rate: • It has not gone up since 2003. • It is lower than Michigan’s average from 1976 to 2006. • It is a little bit closer than usual to the lowest rate in the nation.
That does not change the fact that the estimated unemployment rate for Michigan is: • Higher than anyone wants it to be. • Higher than in any other state. But it does help explain why Michigan’s migration patterns are better than they are usually portrayed to be in the media.