Download
1 / 7
110 likes | 604 Views
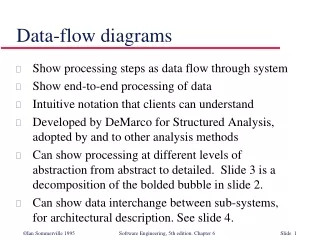
Data Flow Diagrams. Objectives: To define what is meant by structured analysis To define the symbols used in a Data Flow Diagram (DFD) To draw a context diagram (Level 0 DFD) for a given scenario To refine a DFD to a more detailed (lower-level) view. Structured analysis.

E N D
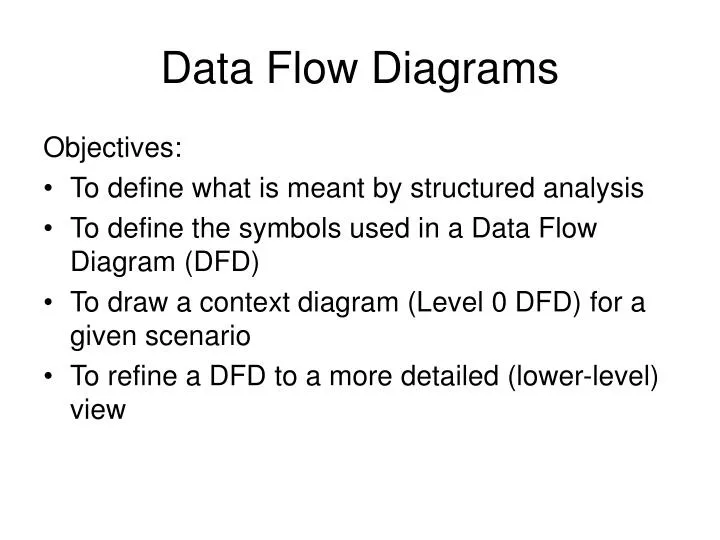
Data Flow Diagrams Objectives: • To define what is meant by structured analysis • To define the symbols used in a Data Flow Diagram (DFD) • To draw a context diagram (Level 0 DFD) for a given scenario • To refine a DFD to a more detailed (lower-level) view
Structured analysis • A widely-used top-down method for defining system inputs, processes and outputs. • It shows how information flows through a system, using several diagrams showing progressively more and more detail at each level. • The primary tool of structured analysis is the Data Flow Diagram (DFD).
Data Flow Diagrams The following four symbols are used in data flow diagrams: External entity Process Data store Data flow
Data flow diagram of a travel agent booking system Customer Travel-query Available flights flights Book flight Booking Booking confirmation
Data flow diagram of part of an order processing system Order Customer Available stock stock Process order Invoice Unfilled order Out-of-stock notice backorders Despatch note Warehouse
Context diagrams a top-level DFD shows the least amount of detail and is known as a Level 0DFD or context diagram. Order Customer Warehouse Invoice Picking List Process order Out-of-stock notice Order rejection notice
Level 0 or context diagram shows a system as a single process with inputs and outputs flowing to or from external entities. • Level 1 DFD will split up that single process into subsystems and show more detail about the data flows and data stores. • Level 2 DFD may decompose a single subsystem even further.