Download
1 / 17
170 likes | 518 Views
Statistics and Simple Plots Outline Announcements: Homework II: due Today. by 5, by e-mail Statistics Simple plots Statistics Descriptive summarize properties of data Comparative compare data sets test hypotheses Descriptive Stats Most common descriptive stats are in “datafun” toolbox

E N D
Outline Announcements: Homework II: due Today. by 5, by e-mail Statistics Simple plots
Statistics Descriptive summarize properties of data Comparative compare data sets test hypotheses
Descriptive Stats Most common descriptive stats are in “datafun” toolbox mean, median, min/max, std vectorized, operate on columns Ex: x & y are column vectors with data m=mean([x,y]) m(1)=mean of x, m(2)=mean of y
Descriptive Stats The descriptive stats functions don’t like nans mean([nan;x]) returns NaN The statistics toolbox has nanmean, nanmin, nanstd,etc. that ignore nans Simple to write your own versions
Basic Comparative Stats Curve fitting with polyfit Correlation coefficient (r) with corrcoef
“Advanced” Comparative Stats Statistics toolbox has functions for regress--like polyfit, but get stats (p, R2) ANOVA
Summary of Matlab Stats Matlab has basic stats built-in Can expand with the stats toolbox Most statistical tests are easy to program Can program Matlab to deal with your data! look for vector-products!
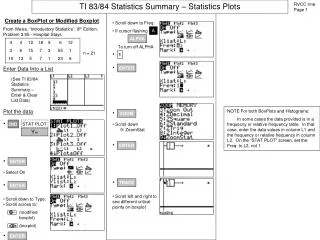
Simple plots Plot 1D functions (2D data) with plot plot(x,y) plots (x,y) with a blue line plot(y) is plot([1:length(y)],y) plot(x,[y1,y2,y3]) plots (x,yX) each in a different color
Customizing plot plot(x,y,’r’) is a red line plot(x,y,’o’) plots circles rather than lines plot(x,y,’yp’) plots yellow pentagrams Type help plot to get more options
Specialized 1D graphics bar--bar chart pie--pie chart polar--polar coordintes semilogy, semilogx, loglog--plotting with log-scales
2D basics Assume data Z is on a regular grid defined by X and Y pcolor, imagesc, contour plot in 2D surf, mesh plot in 3D (perspective)
2D graphics use colors to represent data Color of z is defined by a colormap and caxis several built-in colormaps--help graph3d 2D basics
Generic graphics functions xlabel, ylabel, title label your plots hold on--allows multiple plots on same axes clf clears the figure window axis([xmin,xmax,ymin,ymax]) controls axis properties
Multiple plots subplot(m,n,j) creates the jth plot in an m-by-n matrix of plots n=col m=row
Axes & Figures Matlab plots into figures figure(n) makes n the current figure or creates a figure numbered n Figures contain axes If no axes exist in current figure, then any graphics call will create one Can explicitly create with subplot or axes
Printing figures print will send gcf to printer (or use GUI) print -depsc fname.eps will save graphics in EPS format print -djpeg fname.jpg will save into JPG format