Download
1 / 14
150 likes | 565 Views
Space Weather Effects on GPS. Thomas J. Bogdan, Director Space Weather Prediction Center NCEP/NWS/NOAA 325 Broadway, DSRC Room 2C109 Boulder, CO 80305, USA. How GPS works. Triangulation from known satellite positions Distance calculated based on radio signal travel time

E N D
Space Weather Effects on GPS Thomas J. Bogdan, Director Space Weather Prediction Center NCEP/NWS/NOAA 325 Broadway, DSRC Room 2C109 Boulder, CO 80305, USA
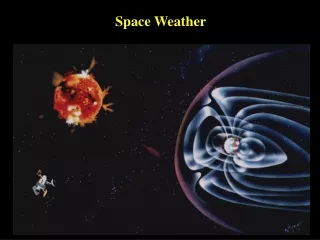
How GPS works • Triangulation from known satellite positions • Distance calculated based on radio signal travel time • Must correct for delays due to propagation through the atmosphere
GPS Error Sources • Typical Error in Meters Standard GPS Differential GPS (per satellites) • Satellite Clocks 1.5 0 • Orbit Errors 2.5 0 • Ionosphere 5.0 0.4 • Troposphere 0.5 0.2 • Receiver Noise 0.3 0.3 • Multipath 0.6 0.6 The ionosphere is the largest source of error for Standard GPS and second largest for Differential GPS http://www.trimble.com/gps/howgps-error2.shtml#3
Ionosphere Effects on GPS The ionosphere is defined as the region of the upper atmosphere where radio signal propagation is affected by charged particles.
SATCOM Message 064. THE QUICK BROWN FOX JUMPS OVER THE LAZY DOGS BACK 01234567<9"TI ?65.( VHE UUicK vROWN$GOX JUMPS OVER†THE!McZY(f~d¸z.9g?_f_}_ j›sSL 33 s %E QUICK$BROWN(FOX JUM‘S OVER THE0L—ZY ?OGS‚—CK 0123456789 TIÌU¤M ?67. (THE QUKcK BROWN GOY"JUMPS _V˜Z ™‰.O ÁOx'??.9 :c™l???0SsQJ.ª:.$~ $U ¶S?IcK0 SˆN …? MUM“Û!_VGS* THE LAZY DOGS BACK 01=3456789 TIMES 069. THE QUICK BROWN FOX JUMPS OVER THE LAZY DOGS BACK 0123456789 TIM Average Signal Level Receiver Fade Margin Scintillation Effects SATCOM MESSAGE ERRORS 15 Ascension Island 12 6 April 1997 9 6 3 Relative Signal Strength (dB) 0 -3 -7 -9 -12 00:21:00 00:22:00 00:23:00 Universal Time (hh:mm:ss) S. Basu, private communication
Ionosphere Challenges October 29th, 2003“walls” of TEC challenge provision of integrity with differential GPS Courtesy: Tom Dehel, FAA TEC “walls”: 130 TEC units over 50 km 20 m of GPS delay; walls move 100 to 500 m/s “wall” SED?
Anomaly crests 1 TECU = 1016 electrons m-2 Mannucci et al., 2005
Space Weather Effects on WAAS July 1, 2003 – March 1, 2005 % CONUS at 95% Availability (Nov 8, 2004) Magnetic Storm Index • 15 hour loss on 10/29; 11.3 hour loss on 10/30, shorter losses on 11/20/2003
Ionosphere Corrections • Need to model the ionosphere to compute corrections • Empirical climatological models: Klobuchar Coefficients • Physics based numerical models: CTIPe, TIE-GCM • Data assimilation schemes: WAAS, US-TEC, GAIM Models can provide specification and forecast The ionosphere is highly variable in space and time
US-TEC Product http://www.sec.noaa.gov/ustec • Current NOAA capability for characterizing the total number of free electrons (TEC) in the ionosphere, with parallel input data streams for reliability • Since 2004, a product characterizing the ionospheric TEC over the continental US (CONUS) has been running in real-time at NOAA’s Space Environment Center (SEC) • The ionospheric data assimilation model uses a Kalman filter and ingests ground-based GPS data to produce 2-D maps of total electron content over the CONUS • Product evolved from a collaboration between SEC and NOAA’s National Geodetic Survey (NGS), National Geophysical Data Center (NGDC), and Forecast Systems Laboratory (FSL) Primary Product: Real-time ionospheric maps of total electron content every 15 minutes. Currently uses about 100 real-time GPS stations from the CORS network
Slant-Path TEC Maps A B Sat. 1 A B Sat. 14 C A B C A B C Sat. 29 Sat. 5 ….etc C Applications: Ionospheric correction for single frequency GPS; NDGPS positioning; dual-frequency integer ambiguity resolution for rapid centimeter accuracy positioning (OPUS). (OPUS)OPUS)
US-TEC Validation Summary Differential TEC: Slant = 2.4 TEC units Vertical = 1.7 TEC units “Absolute” FORTE ray tracing: Slant = 2.7 TEC units Vertical = 1.9 TEC units • Estimated US-TEC slant path total electron content uncertainty < 3 TEC units (equivalent to about 45 cm of signal delay at L1 frequencies) • Estimate US-TEC vertical total electron content uncertainty < 2 TEC units (equivalent to about 30 cm of signal delay at L1 frequencies)
SWPC Ionosphere Goals Produce global real-time specification and forecast Web display of GAIM output from AFWA Assimilation schemes using numerical models: CTIPe, IDEA Improve US-TEC CONUS: Specification with 10 minute latency US-TEC slant path total electron content uncertainty < 2 TECU US-TEC vertical electron content uncertainty < 1 TECU CONUS: Provide Forecast 1 hour forecast as good as specification 3 hour forecast: uncertainty < 3 TEC units 6-12 hour forecasts
Conclusions Ionosphere Services is a fast growing area in Space Weather SWPC is committed to offer improved products and tools SWPC is ready to collaborate on: Data Models and model results Research Services Solar Maximum is on the way (2012?)