Download
1 / 31
330 likes | 704 Views
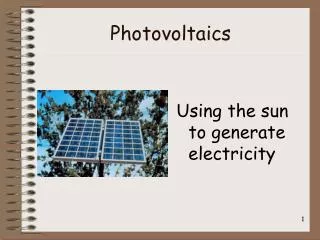
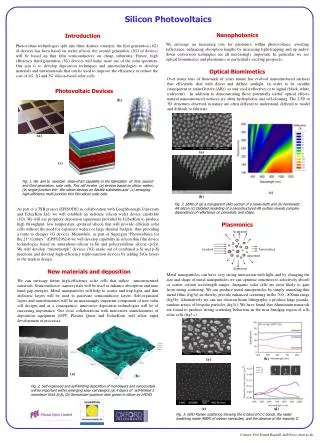
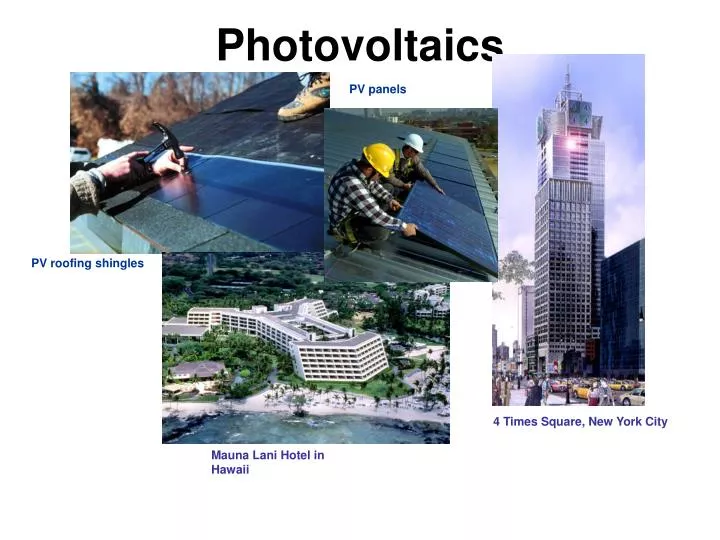
Photovoltaics. PV panels. PV roofing shingles. 4 Times Square, New York City. Mauna Lani Hotel in Hawaii. PV cells are made of special materials called semiconductors and in this case, silicon.

E N D
Photovoltaics PV panels PV roofing shingles 4 Times Square, New York City Mauna Lani Hotel in Hawaii
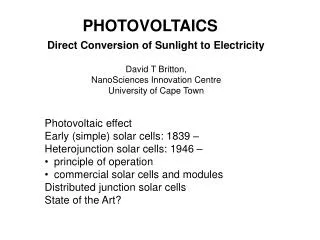
PV cells are made of special materials called semiconductors and in this case, silicon. When a photon (a light particle) hits the panel, it has enough energy to knock an electron loose, allowing it to flow freely. The panel then has several electrical fields to force the electrons to move in a certain direction, creating a current which can be used to do work. How Solar PVs Work
How Solar PVs Work (cont.) • To complete the PV module, several layers are added. A - Cover Glass B - Antireflective Coating C - Contact Grid D - N-type Silicon E - P-type Silicon F - Back Contact • Here is an example of how a home can be wired to run on Solar PV power
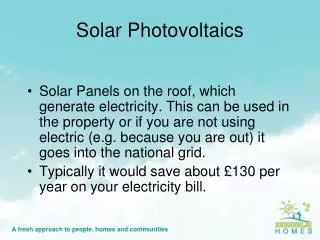
On the Grid, or Off..? • Most residential homes using PV technology are still linked to the Utilities power grid • Other option is storing excess generated energy in battery unit -No alternate source available then
Location, Location, Location - U.S. DEPARTMENT OF ENERGY (2003)
Current trends in photovoltaic system Takuro Kobashi
Current energy demand in the world • Around 0.1% of primary energy demand • Solar electric installations totalled 200MW in 1999, 280MW in 2000 and 340MW by 2001 and 427MW in 2002.
The growth of solar energy The growth rate is among the fastest in energy sources. Most of the growth is driven by the growth in Germany, Japan, and USA. From IEA
Trends in selected countries From IEA
Advantages • Very clean, sustainable, durable, low cost for maintenance. • Solar energy at selected uses (off-grid) already is quite competitive among other energy sources. • The solar energy cost is coming close to the grid connected at some region. In Japan, there is a sign of self-sustaining growth of market.
Advantages • Although still with subsidies, solar energy is expanding at the fastest rate among other energy sources.
Cost • The prices for high power band (>70 Watts) solar modules has dropped from around $27/Wp in 1982 to around $4/Wp today.
Cost: regional difference · 1800 kWh/year in Southern California · 850 kWh/year in Northern Germany · 1600-2000 kWh in India and Australia (1kWp System) Typical kWh usage by homes in three selected US average homes is shown. For example, in a Sacramento, California home, it would cost around $16-$20,000 to satisfy around 25% of that homes energy needs.
Cost • Precise calculation of solar electricity costs depend on the location and the cost of finance available to the owner of the solar installation • With the best PV electricity prices (in the sunniest locations) approaching 30 cents/kWh and the highest tariffs now exceeding 20 cents/kWh • Funding programs that bridge this gap are causing rapid growth in sales of solar PV, especially in Japan and Germany.
Why not? • Expensive for Consumers and Producers • Two years output needed to just equal the amount of energy used in production • Large land areas needed to produce energy on a power plant scale • Limited by intermittence. Stable grids require traditional generating facilities or costly backup to ensure uninterrupted supply. • Due to PV efficiency and low market demand, technological progression is slow. • Environmental concerns in production and disposal • Lack of subsidies and tax credits (In the U.S.)
RESIDENTIAL COST • 2 Kilowatt system: $16-20,000 (installed) - Could meet all needs of a very energy efficient home. - $8-10 per Watt • 5 Kilowatt system: $30-40,000 (installed) - Completely meets energy needs of most conventional homes. -$6-8 per Watt (Estimates from U.S. Department of Energy)
THE COST OF GENERATING ELECTRICITY - Despite cost reductions over the past decade, renewable technologies still require substantial government support to be competitive.
Cost Trends - Photovoltaics 100 80 60 40 20 COE cents/kWh 1980 1990 2000 2010 2020 Current cost is 16-25 cents per kWh Levelized cents/kWh in constant $20001 Source: NREL Energy Analysis Office Updated: June 2002
Production and Disposal Concerns Production - Worker Health and Safety ・Amorphous silicon ム Silane, an explosive gas, is used in making amorphous silicon. Toxic gases such as phosphine and diborane are used to electronically "dope" the material. ・Copper indium diselenide ム Toxic hydrogen selenide is sometimes used to make copper indium diselenide, a thin-film PV material. ・Cadmium telluride ム Cadmium and its compounds, which are used in making cadmium telluride PV cells, can be toxic at high levels of lung exposure. Disposal ・Module lifespan typically around 30 years ・Some material classified as hazardous waste ・Recycling process not yet perfected
Large Scale Solar Power • PV-generated electricity still costs more than electricity generated by conventional plants in most places, and regulatory agencies require most utilities to supply the lowest-cost electricity. • Output dependent on weather • Mostly used in Southwest 150 MW solar power facility in California – the world’s largest Dish collector focuses heat to drive generator Solar furnace project in California
POLICY IMPLICATION FOR RENEWABLE ENERGY: Some industry critics claim we will never power civilization with renewable energy. Fact: Wind & solar are fastest-growing primary power sources, but are unlikely to grow from present ~ 1% of supply (Solar is 0.1 %) to 10% by 2025 and >30% by 2050 without major incentives, R & D and demonstration of enabling technologies. Energy Demand 1980-2020 (BAU) Mbarrels/day oil equiv. Mbarrels/day oil equiv. Mbarrels/day oil equiv.
References • Solar Buzz http://www.solarbuzz.com/index.asp • IEA http://www.iea-pvps.org/
References • Cambridge Energy Research Associates (CERA): Renewables: Challenging the Energy Mix, 2003, a multi-client study • A Consumer’s Guide: Get Your Power from the Sun, U.S. Department of Energy. December 2003 • American Solar Enegy Society (ASES): http://www.ases.org/ • MSNBC archives, Solar power city offers 20 years of lessons, Jeff Donn. June 7, 2004