Download
1 / 22
220 likes | 376 Views
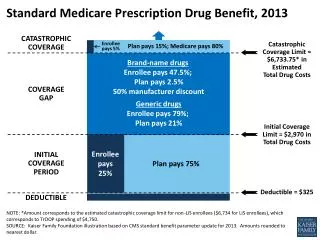
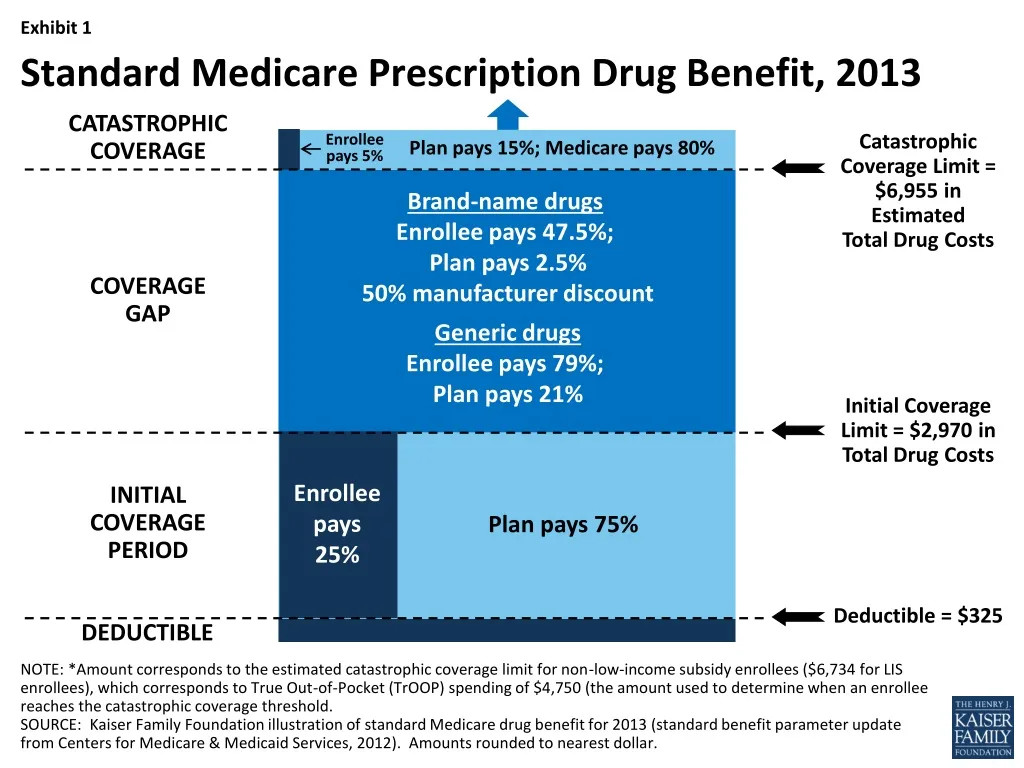
Standard Medicare Prescription Drug Benefit, 2013. CATASTROPHIC COVERAGE. Catastrophic Coverage Limit = $6,955 in Estimated Total Drug Costs. Enrollee pays 5%. Plan pays 15 %; Medicare pays 80%. Brand-name drugs Enrollee pays 47.5%; Plan pays 2.5% 50% manufacturer discount

E N D
Standard Medicare Prescription Drug Benefit, 2013 CATASTROPHIC COVERAGE CatastrophicCoverage Limit = $6,955 in Estimated Total Drug Costs Enrolleepays 5% Plan pays 15%; Medicare pays 80% Brand-name drugsEnrollee pays 47.5%; Plan pays 2.5%50% manufacturer discount Generic drugs Enrollee pays 79%; Plan pays 21% COVERAGE GAP Initial Coverage Limit = $2,970 in Total Drug Costs Enrollee pays 25% INITIAL COVERAGE PERIOD Plan pays 75% Deductible = $325 DEDUCTIBLE NOTE: *Amount corresponds to the estimated catastrophic coverage limit for non-low-income subsidy enrollees ($6,734 for LIS enrollees), which corresponds to True Out-of-Pocket (TrOOP) spending of $4,750 (the amount used to determine when an enrollee reaches the catastrophic coverage threshold.SOURCE: Kaiser Family Foundation illustration of standard Medicare drug benefit for 2013 (standard benefit parameter update from Centers for Medicare & Medicaid Services, 2012). Amounts rounded to nearest dollar.
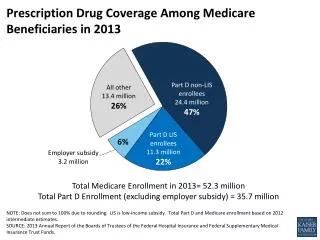
Distribution of Medicare Part D Stand-Alone Prescription Drug Plans, by Benchmark Status, 2006-2013 NOTE: Excludes PDPs in the territories. *Under a Medicare demonstration, de minimis plans were eligible to retain LIS beneficiaries despite exceeding the benchmark premium by $2 in 2007 and $1 in 2008. SOURCE: Georgetown/NORC/Kaiser Family Foundation analysis of CMS PDP Landscape Source Files, 2006-2013.
Weighted Average Monthly Premiums for Medicare Part D Stand-Alone Prescription Drug Plans, 2006-2013 2012-2013: 2% increase 2006-2013: 49% increase NOTE: Average premiums are weighted by enrollment in each year (March for 2013). Excludes Part D plans in the territories. SOURCE: Georgetown/NORC analysis of data from CMS for the Kaiser Family Foundation.
Premiums in Medicare Part D Stand-Alone Prescription Drug Plans with Highest 2013 Enrollment, 2006-2013 NOTE: 1Average premiums are weighted by enrollment in each region for each year. 2Humana Walmart-Preferred PDP was not offered before 2011. 3First Heath Part D Value Plus PDP was not offered before 2012. SOURCE: Georgetown/NORC analysis of CMS 2006-2013 PDP Landscape Source Files for the Kaiser Family Foundation.
Weighted Average Premium for Medicare Part D Basic Stand-Alone PDPs, by Region, 2013 Less than $30(9 regions) $30 to <$32(7 regions) $32 to <$34(9 regions) $34 or higher(9 regions) $33.23ME, NH $33.65OR, WA $29.56 CT, MA, RI, VT $33.24IA, MN, MT, NE, ND, SD, WY $34.59 $41.50 $32.11 $34.12NJ $38.83 ID, UT $35.09PA, WV $28.47 $32.22 $23.13 $38.84DE, DC, MD $34.21IN, KY $28.82 $25.53 $32.18 $31.81 $27.66 $30.64 $32.48AL, TN $35.09 $32.34 $30.65 $28.53 $20.67 $32.13 $31.44 $34.56 $31.85 $30.61 $24.67FL $31.96HI 2013 National Monthly Average Premium for Basic PDPs = $31.98 NOTE: PDP is stand-alone prescription drug plan. Average premiums are weighted by enrollment. SOURCE: Georgetown/NORC analysis of CMS 2013 PDP Landscape Source File for the Kaiser Family Foundation.
Range of Monthly Premiums for National and Near-National Medicare Part D Basic Stand-Alone PDPs, 2013 NOTE: PDP is stand-alone prescription drug plan. SOURCE: Georgetown/NORC analysis of CMS 2013 PDP Landscape Source File for the Kaiser Family Foundation.
Minimum and Maximum Monthly Premiums for Medicare Part D Basic Stand-Alone PDPs, by Region, 2013 Delaware, Maryland, DC Hawaii Florida Texas Georgia New York California Illinois PDP Region # PDP Regions, Sorted from Lowest to Highest Maximum Monthly Premium NOTE: PDP is stand-alone prescription drug plan. SOURCE: Georgetown/NORC analysis of CMS 2013 PDP Landscape Source File and Plan Crosswalk for the Kaiser Family Foundation.
Weighted Average Monthly Premiums for Stand-Alone PDPs, by Type of Benefit Package, 2013 Type of benefit package NOTE: PDP is stand-alone prescription drug plan. SOURCE: Georgetown/NORC analysis of data from CMS for the Kaiser Family Foundation.
Share of Enrollment in Medicare Part D Plans, By Level of Gap Coverage, 2006 and 2013 In 2013, the coverage gap is partially filled by a 50% price discount plus 2.5% plan coverage for brand-name drugs and 21% coverage of generic drug costs, as required by the ACA Level of gap coverage in 2006: PDPs MA-PD plans Level of additional gap coverage in 2013: Little/no additional gap coverage Mostly generics Brands & generics NOTE: Estimates include Part D enrollees receiving low-income subsidies, but who receive coverage for costs in the gap regardless of whether their plan offers it. SOURCE: Georgetown/NORC analysis of CMS Part D landscape and enrollment files, 2006-2013, for the Kaiser Family Foundation.
Weighted Average Monthly Premiums for Medicare Part D Stand-Alone PDPs, by Level of Gap Coverage, 2013 In 2013, the coverage gap is partially filled by a 50% price discount plus 2.5% plan coverage for brand-name drugs and 21% coverage of generic drug costs, as required by the ACA Level of additional gap coverage in 2013 NOTE: PDP is stand-alone prescription drug plan. SOURCE: Georgetown/NORC analysis of data from CMS for the Kaiser Family Foundation.
Share of Medicare Part D Stand-Alone Prescription Drug Plans, By Deductible Amount, 2006-2013 NOTE: Estimates may not sum to total due to rounding and are unweighted. SOURCE: Georgetown/NORC analysis of CMS PDP landscape source files, 2006-2013, for the Kaiser Family Foundation.
Cost Sharing for Medicare Part D Plans, 2006-2013, and Employer-Sponsored Plans, 2013 NOTES Part D cost-sharing amounts are medians; employer plan cost-sharing amounts are means. Part D plan estimates weighted by enrollment in each year; analysis excludes generic/brand plans, plans with coinsurance for regular tiers, and plans with flat copayments for specialty tiers.SOURCE: Georgetown/NORC analysis of data from CMS for MedPAC and the Kaiser Family Foundation; data on employer plans from Kaiser/HRET Employer Health Benefits Survey, 2013.
Share of Enrollment in Medicare Part D Plans with Specialty Tiers, by Specialty Tier Coinsurance Rate, 2009-2013 PDPs MA-PD plans Coinsurance rates: NOTE: Estimates weighted by enrollment in each year. Analysis of MA-PD plans excludes Special Needs Plans.SOURCE: Georgetown/NORC analysis of data from CMS for the Kaiser Family Foundation.
Share of Medicare Part D Stand-Alone PDP Enrollees with Coverage of Top Ten Brand-Name Drugs, by Formulary Tier, 2013 NOTE: PDP is stand-alone prescription drug plan. Analysis is weighted by enrollment. Preferred brand includes plans using standard benefit without tiers. Non-preferred brand includes plans using specialty tiers. SOURCE: NORC/Social & Scientific Systems analysis of data from CMS.
Share of Covered Drugs with Utilization Management (UM) Restrictions Across All Medicare Part D Stand-Alone PDPs, 2007-2013 NOTE: PDP is stand-alone prescription drug plan. Calculations are share of listed chemical entities, weighted by enrollment in each year.SOURCE: NORC/Social & Scientific Systems analysis of data from CMS.
Share of Medicare Part D Stand-Alone PDP Enrollees Facing UM Restrictions for Top Ten Brand-Name Drugs, 2013 NOTE: PDP is stand-alone prescription drug plan. UM is utilization management. Presence of UM restrictions is measured as a share of plans with the drug listed on formulary.SOURCE: NORC/Social & Scientific Systems analysis of data from CMS.
Distribution of Monthly Part D Premiums for Low-Income Subsidy PDP Enrollees Paying Premiums, 2006-2013 NOTE: PDP is stand-alone prescription drug plan. SOURCE: Georgetown/NORC analysis of CMS 2006-2013 PDP Landscape and Enrollment files for the Kaiser Family Foundation.
Number of Low-Income Subsidy PDP Enrollees Paying Monthly Premiums, 2006-2013 NOTE: PDP is stand-alone prescription drug plan. SOURCE: Georgetown/NORC analysis of CMS 2006-2013 PDP Landscape and Enrollment files for the Kaiser Family Foundation.
Share of Medicare Part D Stand-Alone PDPs and PDP Enrollees, by Plan Star Ratings, 2013 4 or more stars NOTE: PDP is stand-alone prescription drug plan. Unrated plans are excluded from percentages.SOURCE: Georgetown/NORC/Kaiser Family Foundation analysis of CMS Ratings, 2013.
Top 10 Firms Offering Medicare Part D Plans Ranked by 2013 Enrollment NOTE: Includes plans in the territories and employer plans. SOURCE: Georgetown/NORC/Kaiser Family Foundation analysis of CMS Enrollment Files, 2006-2013.
Top 10 Medicare Part D Plans Ranked by 2013 Enrollment NOTE: Includes plans in the territories and employer plans. SOURCE: Georgetown/NORC/Kaiser Family Foundation analysis of CMS Enrollment Files, 2006-2013.
Top 5 Medicare Part D Stand-Alone PDPs, Ranked by 2013 LIS Enrollment and Non-LIS Enrollment NOTE: LIS is low-income subsidy. Excludes employer group plans and plans in the territories. SOURCE: Georgetown/NORC analysis of CMS PDP Landscape and Enrollment Files, 2013, for the Kaiser Family Foundation.