Download
1 / 27
270 likes | 499 Views
Accounts Receivable and Inventory. Chapter 19. May 4, 2009. Learning Objectives. How and why firms manage accounts receivable and inventory. Computation of optimum levels of accounts receivable and inventory. Alternative inventory management approaches.

E N D
Accounts Receivable and Inventory Chapter 19 May 4, 2009
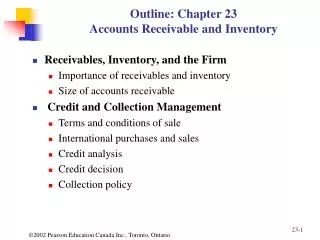
Learning Objectives • How and why firms manage accounts receivable and inventory. • Computation of optimum levels of accounts receivable and inventory. • Alternative inventory management approaches. • How firms make and evaluate credit policy decisions
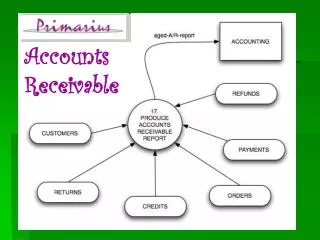
Why do firms accumulate accounts receivable and inventory? • Given that accounts receivable and inventory are assets that do not provide an explicit rate of return, it is important to understand why firms might still want to have these investments. • Granting credit, resulting in Accounts Receivable, is often an essential business practice and can enhance sales. (But also will increase costs.) • Holding adequate inventory is necessary to avoid loss of sales due to stock-outs and have an efficient manufacturing process.
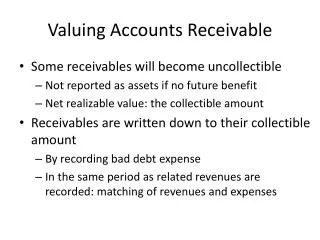
Finding the Optimum Level of Accounts Receivable • Accounts Receivable represent your money sitting in someone else’s bank account. It earns you nothing! • So, if the firm does grant credit, how do we minimize the impact on cash flow • Firm’s managers must review the firm’s credit policies and evaluate the impact of any proposed changes in policies based on the NPV of incremental cash flows due to the proposed changes
Accounts Receivable - Terms • The terms of sale are generally stated in the form X / Y, n Z • This means that the customer can deduct X percentage if the account is paid within Y days; otherwise, the full amount must be paid within Z days. Example: 2/10 n 30 • The company offers a 2% discount if the invoice is paid in 10 days. Otherwise, • Balance due in 30 days.
Average Collection Period (ACP) • Old Policy; 2/10, n30 • 35% of customers pay in 10 days • 62% of customers pay in 30 days • 3% of customers pay in 100 days • ACP=(.35x10)+(.62x30)+(.03x100)=25.1 days • New Policy; 2/10, n40 • 35%of customers pay in 10 days • 60% of customers pay in 40 days • 5% of customers pay in 100 days • ACP=(.35x10)+(.60x40)+(.05x100)=32.5 days (If sales are $1M per day, this will cost $7.4M!)
Analysis of Accts. Receivable Changes to Credit Policy • Develop pro forma financial statements for each policy under consideration. • Use the pro formas to estimate incremental cashflows by comparing forecasts to current policy cash flows. • Use the incremental cash flows to estimate the NPV of each policy change. • Choose the policy change that maximizes the value of the firm (highest NPV).
Analysis of Accts. Receivable Changes • Example:ABC Corporation is considering a credit policy change from offering no credit to offering 30 days credit with no discount • Why might they do this? -Increase sales -Increase market share • What costs will the firm incur as a result? -Cost of carrying accounts receivable -Potential increase in bad debts -Credit analysis and collection costs
Analysis of Accts. Receivable Changes • Assume the Net Incremental Cash Flows associated with ABC’s new credit policy are as follows: (They lose one month of cash flow which they will have to borrow) • External financing (Init. Investment) = $28,000 t=0 • Increase in sales = $30,000 • Increase in COGS = $15,000 • Increase in Bad Debts = $3,000 • increase in Other Expenses = $5,000 • Increase in Interest Expense = $500 • Increase in Taxes = $2,600 • Total Incr. Operating Cash Flow = $3,900/yr.
Analysis of Accts. Receivable Changes • Calculate the NPV of the change (k = 12%): • PV of the expected inflows of $3,900 per year from t = 0 to infinity (perpetuity) = $3,900/.12 = $32,500 • NPV = PV of inflows - initial investment = $32,500 - $28,000 = $4,500 • Since NPV > 0, ABC should undertake the credit policy change • Note: If they keep the $28,000, cash flow at 12% = $3,360
Methods of Collection Most firms use some of the following: • Send reminder letters. • Make telephone calls. • Send in big Gene • Hire collection agencies. • Sue the customer. • Settle for a reduced amount. • Write off the bill as a loss. • Sell accounts receivable to factors.
Inventory Management • Typically, inventory accounts for about four to five percent of a firm's assets. In manufacturing firms, this could be 20 to 25% of the firm’s assets. • Inventory sitting on your shelf earns nothing! • In fact, it costs you 20 to 30% of the value of the inventory just to keep and maintain it. • Therefore, the objective is to minimize the investment in inventory without sacrificing production requirements
Inventory Mangement • In order to effectively manage the investment in inventory, two problems must be dealt with: how much to order and how often to order. • The economic order quantity (EOQ) model attempts to determine the order size that will minimize total inventory costs.
Total Inventory Costs Total Carrying Costs Total Ordering Costs = + Inventory Management • Determining Optimal Inventory (where total costs are minimized) Note: We are not talking about the cost of the Inventory itself, but costs of holding and maintaining the inventory
Inventory Costs • Carrying Costs Warehouse rent, insurance, security costs, utility costs, maintenance costs, property taxes, move and re-arrange, obsolescence, and opportunitycost, i.e., using cash for profitable projects rather than being tied up in inventory. • Ordering costs Clerical expense, telephone, Material Resource Planning (MRP) system, management time, receiving costs, etc.
The EOQ Model assumes the firm orders a fixed amount (Q) at equal intervals. Inventory Level (units) Order Quantity Q Time
Inventory Level (units) Order Quantity 2 Average inventory = Order Quantity Q Time The EOQ Model
Total Inventory Costs Total Carrying Costs Total Ordering Costs Total Inventory Costs OQ 2 S OQ ( ) CC + ( ) OC = + = Where: OQ = Order Size (order quantity) S = Annual Sales Volume CC = Carrying Cost per Unit OC = Ordering Cost per Order
S OQ Ordering Costs = ( )OC Cost ($) Ordering Costs, per unit Ordering costs per unit go down as order size increases. Assumes ordering costs are relatively fixed. Order Size (units)
S OQ Ordering Costs = ( )OC OQ 2 Carrying Costs = ( ) CC Cost ($) Order Size (units) Carrying Costs Carrying costs increase as the size of the inventory increases.
S OQ Ordering Costs = ( )OC OQ 2 Carrying Costs = ( ) CC Total Costs = Carrying Costs + Order Costs Total Cost = OQ x CC + S x OC 2 OQ Cost ($) Y The economic order quantity is the intersection of the X and Y points where total inventory cost is minimized X Order Size (units)
2 x S x OC CC OQ = Inventory Management • Determining Optimal Inventory • The ordering quantity that minimizes the total costs of inventory.
2 x S x OC CC OQ = 2(1560)40 50 = = 49.96 50 cars Inventory Management • Determining Optimal Inventory • Economic Order Quantity (EOQ) Example: Awesome Autos expects to sell 1,560 new automobiles in the next year. It currently costs $40 per order placed with the manufacturer. Carrying costs amount to $50 per auto. How many autos should they order each time they place an order?
Inventory Management • Determining Optimal Inventory • Economic Order Quantity (EOQ) Example: Awesome Autos expects to sell 1,560 new automobiles in the next year. It currently costs $40 per order placed with the manufacturer. Carrying costs amount to $50 per auto. How many autos should they order each time they place an order? How many orders per year? OQ 50autos in each order Place 1,560/ 50 = 31.2 orders each year Order cost = 31.2 x $40 = $1,248
Inventory Reorder Point • If total demand is 1560 and 52 weeks in year, then 1,560 / 52 or 30 cars sold per week. • If it takes one week to get a shipment of cars from the manufacturer, then 1 x 30 or when you get down to 30 cars, they would reorder
Safety Stock • Assume Awesome autos does not want to risk running out of cars and lose sales • They determine that to offset variations in the delivery cycle, they need a safety stock of 20 autos • The amount of safety stock is added to the inventory reorder point • So the new inventory reorder point would be 30 plus 20 or 50 autos
Inventory Level (units) Time Inventory Management with Safety Stock- Order before inventory is at zero. Inventory Order Point 70 EOQ 50 Depleted Stock During Delivery 20 Safety Stock Actual Delivery Time