Download
1 / 19
190 likes | 274 Views
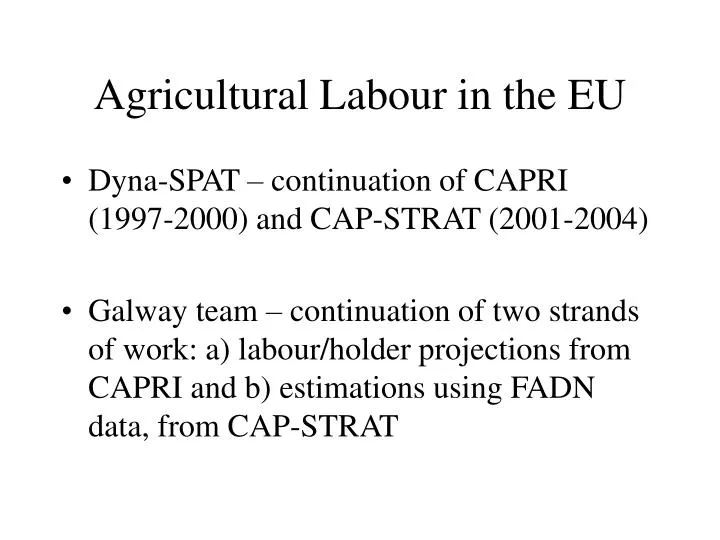
Agricultural Labour in the EU. Dyna-SPAT – continuation of CAPRI (1997-2000) and CAP-STRAT (2001-2004) Galway team – continuation of two strands of work: a) labour/holder projections from CAPRI and b) estimations using FADN data, from CAP-STRAT. CAPRI. Main Papers to be followed up from:

E N D
Agricultural Labour in the EU • Dyna-SPAT – continuation of CAPRI (1997-2000) and CAP-STRAT (2001-2004) • Galway team – continuation of two strands of work: a) labour/holder projections from CAPRI and b) estimations using FADN data, from CAP-STRAT
CAPRI • Main Papers to be followed up from: • 1) A Regional Analysis of the Changing Structure of Agricultural Land Holdings; by Steele and Gaffney (98-05) • 2) Notes on Agricultural Labour; by Steele and Garvey (00-01)
1. WP 98-05 • Main Focus on Methodology of Cohort Analysis e.g.
Cohort Analysis gives Autonous Change • It is possible to then model NA, the non-autonomous change (the difference between expected and actual changes) • Some examples of results follow….
CAP-STRAT: also 2 papers • 1)Estimation of Input Allocationfrom EU Farm Accounting Datausing Generalized Maximum Entropy; Britz and Garvey, 2002 (Valencia) • 2) Integration of input estimates into the CAPRI data base; Britz, Adenäuer, Pfaffenzeller, Garvey, McInerney, 2004 (Leuven-la-neuve)
Paper 1 • Implemented an Entropy Approach to Input Estimations, incorporating a number of FOC’s and constraints. • Included Labour Coefficients. • Unfinished business……
Paper 2 • Straightforward ‘non-system/univariate’ econometric estimations using the same FADN data • Estimates found for a number of sometimes fairly aggregated inputs, not including unpaid family labour (though wages in real terms are included)
Reconciliation with EAA’s • These econometric estimates (at national level) are then reconciled with EAA’s, using additional sources of information (in particular, standard gross margins). • Regionalization is possible based on (some of) the econometric coefficients and the regional SGMs. However, there is not full econometric regionalization.
Next Steps….. • 1) More detailed FADN estimations, with emphasis on labour • 2) Consider accession countries……. • 3) Revisit Paper 1 of CAP-STRAT • 4) Development of Cohort calculations – but how to tie into CAPRI?
1) New FADN Estimations • A) Incorporate regional slope coefficients • B) Incorporate Labour (different types?), with farm size multiplicative effects • C) Include more disaggregated inputs where possible • D) Use more recent extraneous info. in EAA reconciliations (e.g. SGMs)
2) Accession Countries’ Farm Labour • The double problem – projections and input estimations. Presumably use can be made of FADN type data for the latter. • For the former, long term trends may have set in by now – maybe not…….
3) Revisit Paper 1) CAP-STRAT • Possible – but unlikely to have time/resources. Nevertheless, some sort of system approach might be possible. Issue of incorporating economic behaviour into the estimations is interesting.
4) Cohort Calculations, Other Sectors and CAPRI • Cohort projections give autonomous changes in the number of holders. The difference between this change and the actual change ex post can be put down to Economic factors mainly. These can be estimated at some fairly aggregated level.
Another possibility …… Some sort of dynamic Markov Chain analysis In either case the important thing is to model a link between the wider Economy and Farm Entry/Exit, and – by implication – farm size.
Linking the two tasks….. • Using some sort of link (probably farm size) the wider economic model can link with labour inputs e.g. non-Ag. GDP rises, expected returns to non-Ag. work rise, people leave agriculture, average farm size rises. This means – linking to L inputs - that labour used per activity (almost certainly) falls and farm income per capita rises.