Download
1 / 8
80 likes | 153 Views
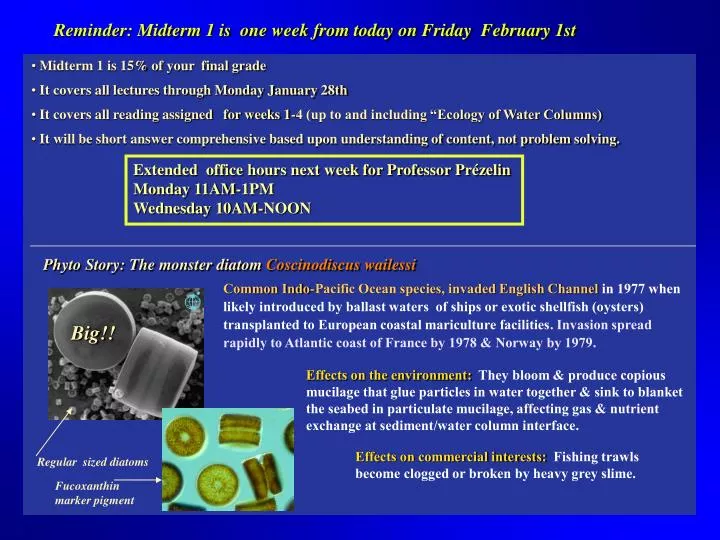
Big!!. Reminder: Midterm 1 is one week from today on Friday February 1st. Midterm 1 is 15% of your final grade It covers all lectures through Monday January 28th It covers all reading assigned for weeks 1-4 (up to and including “Ecology of Water Columns)

E N D
Big!! Reminder: Midterm 1 is one week from today on Friday February 1st • Midterm 1 is 15% of your final grade • It covers all lectures through Monday January 28th • It covers all reading assigned for weeks 1-4 (up to and including “Ecology of Water Columns) • It will be short answer comprehensive based upon understanding of content, not problem solving. Extended office hours next week for Professor Prézelin Monday 11AM-1PM Wednesday 10AM-NOON Phyto Story: The monster diatom Coscinodiscus wailessi Common Indo-Pacific Ocean species, invaded English Channelin 1977 when likely introduced by ballast waters of ships or exotic shellfish (oysters) transplanted to European coastal mariculture facilities. Invasion spread rapidly to Atlantic coast of France by 1978 & Norway by 1979. Effects on the environment: They bloom & produce copious mucilage that glue particles in water together & sink to blanket the seabed in particulate mucilage, affecting gas & nutrient exchange at sediment/water column interface. Effects on commercial interests: Fishing trawls become clogged or broken by heavy grey slime. Regular sized diatoms Fucoxanthin marker pigment
Light-inhibited PP and m Light saturated PP and m at ~60 % Pmax, cell division rates become maximal, eg. m =mmax Light limited PP but Light saturated m Light limited PP & Growth rates (m ) No PP, No growth, possible Senescence (decay, death, ), formation Resting stages, Pmax
slopes b, beta a, alpha Ik It a b = Ps rate/ PFD Ik = Pmax/alpha It = Pmax/beta Parameters of Photosynthesis-Irradiance curves Photosynthetic potential Chl-specific a = relative quantum yield Indices of Photoadaptation Photoinhibition without photoinhibition,Ps = Pmax . tanh (I/Ik) with photoinhibition,Ps = [Pmax . tanh (I/Ik)] minus [ eq. describing shape of beta] Beta varies from a linear to exponential decline
Comparison of P-I curves for different algae under different growth conditions P-I relationships are a “signature” of the photo-physiological state of the phytoplankton cell, population, and mixed community • Which has the highest Pmax? • Which has the highest alpha? • Which has the lowest Ik? • At 50 mEin m-2 s-1, which has the greatest rates of Ps? • At 200 mEin m-2 s-1, which has the greatest rates of Ps? • Above what QPAR does Ceratophylum Ps rates exceed those of Hydrilla? One mole of hv = one Einstein of hv = one Ein = 6.02 x 10 23 molecules
P-I sampling strategies for determination of in situ rates of primary productivity, PP For determinations of instantaneous in situ PP at one place (z) and time (t) PPz,t, expressed as mg C/m3/hr or mgC/mg Chl/hr need to measure (Qpar)z,t and (Chl a)z,t and experimentally determine (P-I)z,t, using (P-I)z,t, could estimate PP for other conditions (Qpar)z,t and (Chl a)z,t although the accuracy would depend on the P-I response remaining constant i.e. Daily rates of PP at same location (PP)z, expressed as mg C/m3/day or mgC/mg Chl/day i.e. Integrated water column PP (SPP)t, expressed as mg C/m2/hr or mgC/mg Chl/hr) i.e. Daily integrated water column PP SPP, expressed as mg C/m2/day or mgC/mg Chl/day) Accuracy increases with knowledge of how P-I, Chl a, and Qpar vary as f(x) of t,z.
Case Study: Santa Barbara Channel (SBC) Pt. Conception, at the western boundary of the Santa Barbara Channel (SBC), is a major biogeographic and coastal oceanic boundary that strongly influences the physical and biological dynamics of the marine ecosystems within the Channel. SBC is considered a transition zone between cold water ecosystems to the north of Pt. Conception and the warm water ecosystems of Southern California. This is one reason why there is a rich diversity of animal and plant life within the SBC. A most excellent place for research!!
Before SBC, brief summary of various bio-optical approaches to estimate in situ PPz,t • Optical measurements of QPAR(l)z,t, measured or estimated aph(l)z,t, assumed or estimated operationalf(l) z,t.FULLY SPECTRAL APPROACH PP z,t = SPAR(QPAR(l)z,t xaph(l ) z,txf(l )z,t) • Field measurements will also include vertical profiles of [Chl a] for biomass estimates. • If accessory pigments also measured, could tell how phytoplankton community composition varied in space and time. • If temperature or density profiles measured, could tell how PP was distributed with respect to water mass type and potential vertical mixing. • If nutrients were measured, could tell if phytoplankton if productivity was likely to be nutrient-limited or nutrient-repleted 2. Gas Exchange Experiments ( hv-dependent rates of O2 evolution or inorganic carbon uptake) a) for O2 gas exchange, bottle experiments in situ or O2 electrode experiments under simulated in situ (sis) conditions. b) for radiolabeled H14CO3/14CO2 uptake experiments, bottle experiments in situ or photosynthetron experiments under sis conditions. In situ studies give rates of PPz.t whether or not QPAR is known while sis studies of PP require knowledge of in situ depth profiles of QPAR and [Chl]
Chl biomass as f(x) of depth (z) hv PP Can predict in situ Ps rates if Chl distribution or QPAR profiles change In situ bottle measurements provide estimtew ofin situ rates of PP for one t,z but has no predictive value P-I approach allows for estimating and predicting in situ PP for any t,z where light &Chl are known • NB: this FW experiment measured O2 changes in bottles, which is why respiration values are reported • marine PP studies use C14 uptake bottles similarly deployed; do not get respiration rates and PP measurement is something between NPP and GPP • Problem with C14 bottles, some of uptake C14 gets respired during long incubations & bacteria accumulate & community biology changes Photoinhibition and/or photorespiration Light saturated photosynthesis, Pmax Light-limited (alpha portion of P-I curve) IF water column was well mixed, Chl was constant as a function of depth, & just one P-I Curve could describe phytoplankton photophysiology throughout the water column, then the depth-dependent PP could be viewed as