Download
1 / 24
240 likes | 382 Views
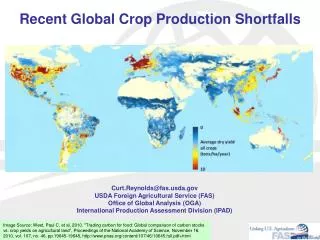
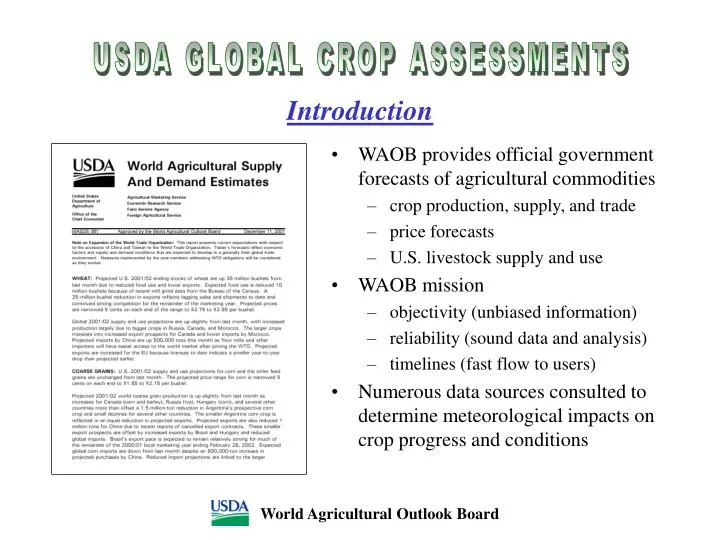
World Agricultural Outlook Board. USDA GLOBAL CROP ASSESSMENTS. Introduction. WAOB provides official government forecasts of agricultural commodities crop production, supply, and trade price forecasts U.S. livestock supply and use WAOB mission objectivity (unbiased information)

E N D
World Agricultural Outlook Board USDA GLOBAL CROP ASSESSMENTS Introduction • WAOB provides official government forecasts of agricultural commodities • crop production, supply, and trade • price forecasts • U.S. livestock supply and use • WAOB mission • objectivity (unbiased information) • reliability (sound data and analysis) • timelines (fast flow to users) • Numerous data sources consulted to determine meteorological impacts on crop progress and conditions
U.S. and World Weather Official Country Reports Attaché Reports USDA’s Economic Intelligence System Travel Reports Economic and Trend Analysis Remote Sensing
National Agricultural Statistics Service Joint Agricultural Weather Facility Foreign Agricultural Service Economic Research Service Farm Service Agency ERS Situation and Outlook Reports Weekly Weather and Crop Bulletin Domestic Production and Stocks Estimates World Agricultural Supply and Demand Estimates FAS Commodity Circulars Long-term Baseline Projections USDA’s Economic Intelligence System World Agricultural Outlook Board
World Agricultural Outlook Board USDA GLOBAL CROP ASSESSMENTS U.S. Exports as Percent of Production Wheat, Corn, and Soybeans 78.1 Wheat 55.7 46.7 45.2 Soybean 34.4 20.3 Corn
World Agricultural Outlook Board USDA GLOBAL CROP ASSESSMENTS U.S. Agricultural Trade U. S. AGRICULTURAL TRADE Fiscal Year, 1976 - 2003 Fiscal Year, 1976 - 2003 Billion Dollars MMT 70 220 57.0 59.9 60 200 2003 Forecast 50 180 Exports in value 40 160 30 140 136.4 Bulk commodities exports in volume 20 120 109.1 10 100 0 80 78 82 86 90 94 98 02 76 80 84 88 92 96 00 Year
World Agricultural Outlook Board USDA GLOBAL CROP ASSESSMENTS U.S. Wheat Supply and Demand
Australia Wheat Supply and Use, 2000/01- 2002/03 China Wheat Supply and Use, 2000/01- 2002/03 World Agricultural Outlook Board USDA GLOBAL CROP ASSESSMENTS
World Agricultural Outlook Board USDA GLOBAL CROP ASSESSMENTS World Wheat Ending Stocks & U.S. Wheat Prices Introduction Marketing Year, 1976 – 2002 World Ending Stocks 207.0 171.5 4.55 U.S. Wheat Price 3.55 - 3.65
World Agricultural Outlook Board USDA GLOBAL CROP ASSESSMENTS U.S. Net Farm Income & Direct Government Payments 1990 - 2003 44.9 2003 Forecast 54.8 Net Farm Income 22.9 17.6 Direct Government Payments
World Agricultural Outlook Board USDA GLOBAL CROP ASSESSMENTS El Niño • Below-normal precipitation is often observed in parts of Australia during El Niño episodes • Satellite-derived sea-surface temperature data beneficial, providing an early warning of potential crop failure • Historically, winter wheat yields are reduced in El Niño years, sometimes dramatically Source: NOAA/NWS/CPC http://www.cpc.noaa.gov/products/analysis_monitoring/enso_update/sstanim.html
World Agricultural Outlook Board USDA GLOBAL CROP ASSESSMENTS Surface Weather Observations • Surface weather observations confirmed the development of drought, helping to quantify precipitation and temperature anomalies in major crop producing areas
World Agricultural Outlook Board USDA GLOBAL CROP ASSESSMENTS Satellite Data • Remote-sensing data corroborated these surface weather observations, providing additional insight on climate anomalies (e.g., spatial extent of drought) and local extreme events (e.g., dust storms) Source: NOAA/NWS/NCDC http://lwf.ncdc.noaa.gov/servlets/SSMIBrowser Source: NOAA/NESDIS/OSEI http://www.osei.noaa.gov/Events/Dust/Australia/2002/DSTaust296_GM.jpg
World Agricultural Outlook Board USDA GLOBAL CROP ASSESSMENTS Higher Resolution Satellite Data Imagery illustrates better crop conditions in 2001 than in 2002 2002 2001 Northern New South Wales Source: PECAD
Moderate to strong: El Niño World Agricultural Outlook Board USDA GLOBAL CROP ASSESSMENTS South Africa Corn Yields
Late planting Early planting World Agricultural Outlook Board USDA GLOBAL CROP ASSESSMENTS South Africa Crop & Weather Data Vegetation conditions in eastern region are below average Source: PECAD Source: PECAD Source: PECAD
World Agricultural Outlook Board USDA GLOBAL CROP ASSESSMENTS Winterkill Analyses Satellite-derived snow cover and surface temperature observations analyzed… snow cover protects dormant winter grains from bitterly cold weather in Russia Russia Ukraine Source: NOAA/NESDIS/SSD http://www.ssd.noaa.gov/PS/SNOW/DATA/LOOP/asia-1mo-loop.html
World Agricultural Outlook Board USDA GLOBAL CROP ASSESSMENTS Tropical Cyclones • Satellite imagery provides insight into the potential spatial extent of crop damage associated with land-falling tropical cyclones • In this example, visible satellite imagery of Hurricane Kenna was imported into a GIS • When such images are overlaid crop production and area data in a GIS, analysts can estimate storm impacts on crop progress and conditions Imagery Source: NOAA/NESDIS/SSD http://www.ssd.noaa.gov/PS/TROP/trop-epac.html
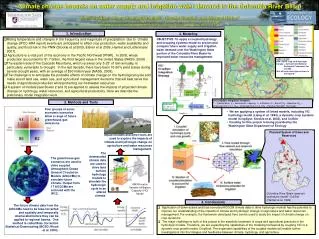
World Agricultural Outlook Board USDA GLOBAL CROP ASSESSMENTS U.S. and South America Soybean Production Source: PECAD
1,000 Hectares per Municipio: (1996) NDVI Vegetation Index < 1 1-10 10-50 50-100 100+ Sparse Vegetation Dense Vegetation World Agricultural Outlook Board USDA GLOBAL CROP ASSESSMENTS BRAZIL: Soybean Area Distribution BRAZIL: Vegetation Index – Jan 31, 2003 Bolivia Bolivia Paraguay Paraguay Argentina Argentina Source: PECAD Source: IBGE Brazil
World Agricultural Outlook Board USDA GLOBAL CROP ASSESSMENTS Changes in Balance of First and Second Crops • 82% of Argentina’s soybean planted area is expected to be planted to first-crop soybeans in 2002/03 • Average portion is 70% • First-crop soybean yields average 2.49 tons/ha • Second-crop soybean yields average 1.92 tons/ha Source: SAGPyA, USDA
January 22, 2002 Landsat-7 ETM Ch-4,5,3 January 16, 2003 Landsat-7 ETM Ch-4,5,3 World Agricultural Outlook Board USDA GLOBAL CROP ASSESSMENTS Changes in Crop Area Landsat satellite imagery shows more area devoted to summer crops in 2002/03 Source: PECAD
World Agricultural Outlook Board USDA GLOBAL CROP ASSESSMENTS Citrus Freeze Surface temperature observations indicate the potential for a damaging freeze in Florida citrus areas
T(C) -10 0 10 Source: NOAA/NWS/CPC – 4km IR image from GOES 8 World Agricultural Outlook Board USDA GLOBAL CROP ASSESSMENTS Citrus Freeze Infrared satellite imagery can be used to show detail in areas where surface observations are not available 02 February 2003
USDA GLOBAL CROP ASSESSMENTS Wish List • Provide near real time availability • Develop new products, specifically those that quantify rather than qualify • precipitation (values vs. “wet” or “dry”) • surface air temperature (values vs. “hot” or “cold”) • soil moisture/temperature • snow cover/depth • wind speed/direction • Increase global coverage • penetrate cloud cover • expand country coverage • Resolution, food for thought… • 32 km x 32 km (20 mi x 20 mi) would provide at least one measurement per county for most counties. Same density targeted by NOAA for Cooperative Observer Network. • higher resolution needed for some specialty crops • Develop data archive for purpose of establishing “normals” • Establish user-friendly data formats/downloading procedures