Download
1 / 43
440 likes | 559 Views
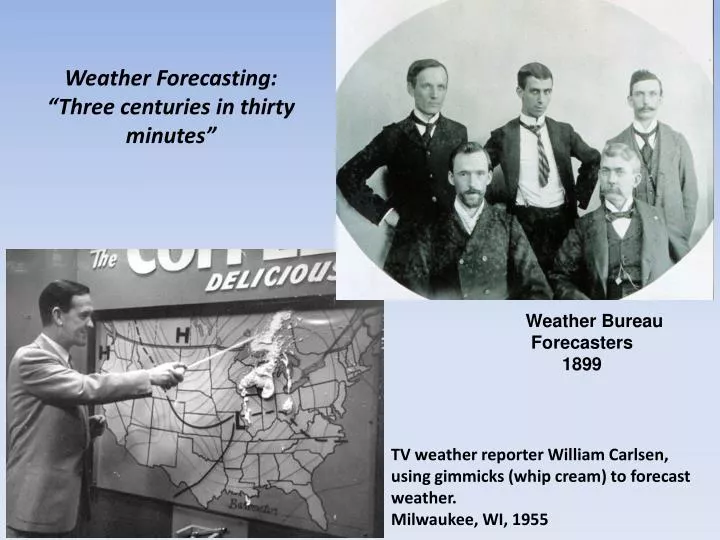
Weather Forecasting: “Three centuries in thirty minutes”. Weather Bureau Forecasters 1899. TV weather reporter William Carlsen , using gimmicks (whip cream) to forecast weather. Milwaukee , WI, 1955. Francois Arago , 1786-1853.

E N D
Weather Forecasting: “Three centuries in thirty minutes” Weather Bureau Forecasters 1899 TV weather reporter William Carlsen, using gimmicks (whip cream) to forecast weather. Milwaukee, WI, 1955
Francois Arago, 1786-1853 “Never, no matter what may be the progress of science, will honest scientists who care for their reputation venture to predict weather.”
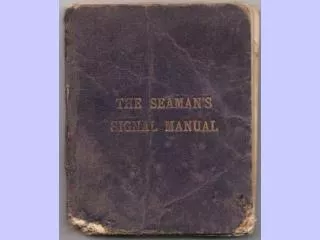
Robert FitzRoy London, 1861 “Father of the Weather Forecast”
Elias Loomis 1811-1889 Weather Map, 1870 “Such a set of maps would be worth more than all hitherto done in meteorology. The subject may nigh be exhausted. But one year of maps would be needed, the storms of one year are probably a repetition of those proceeding.”
On Great Lakes in 1868 – 1,100 ships damaged, 321 mariners killed Great Lakes ship, 1864
Cleveland Abbe, Cincinnati, OH 1838-1916 1st Chief Meteorologist US Army Signal Service “We do not propose to guess at weather – we leave that to the almanac makers, but we shall be able to assert the nature of the weather up to four days in advance.”
US Post Office Weather flags - 1873 Fair weather Rain or snow Local rain or snow Cold wave
Waves from Ike crash over the Galveston Seawall in front of the memorial to the Hurricane of 1900 (over 6000 died) Houston Chronicle Photo
Isaac Cline Weather Bureau Forecaster Galveston, TX 1900 “The opinion that Galveston will at some time be seriously damaged by a hurricane is simply an absurd delusion and can only have its origin in imagination and not from reasoning. ”
Path of the Galveston, TX hurricane September 8, 1900
Galveston, TX, September 1900 Waves = 15 ft, Galveston = 8.7 ft
The Track of Great New England Hurricane of 1938 The storm was into Connecticut before the warning was issued for Long Island The hurricane was tracking north at 60 mph when it hit Fire Island, which was hit by 15-20 foot storm surge A wind gust of 186 mph was recorded at the Blue Hill Observatory in Massachusetts.
Scenes from southern New England during/after the Hurricane of 1938
In New England an estimated 275 million trees were destroyed 700 lives were lost. Almost 9000 homes destroyed
The Greatest Forecast Ever Made…
Gen Eisenhower wanted: Full moon 40 minutes of daylight Low tide Good weather
600 warships 4,000 troop ships 11,000 aircraft 160,000 troops
U.S. Weather Bureau staff Green Bay 1943-44. Eleanor, Winnie, Hilda (in charge), Marian. Weather Bureau: 1941 - 2 women 1945 - 900 women Hilda climbing a 40 foot tower (on top of a six story building) to fix the wind equipment - 1943
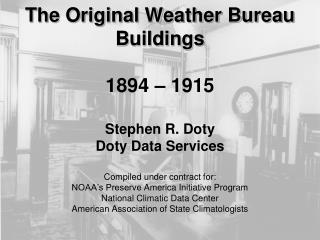
Although much better than what meteorologists had during the Normandy Invasion, these maps were a far cry from what was to come. In the 1980s (and first part of the 90s) forecasters received their maps via a printer. These computer models – projections of the future…were one dimensional and monochromatic
In the 1980s and 90s, the NWS used a system called AFOS to look at weather maps. Images were again monochromatic. This could only display maps; satellite imagery, lightning activity, and radar had to all be viewed on different machines/ screens.
NOAA Geostationary Orbiting Equatorial Satellite (GOES), visible image GOES satellites orbit 22,400 miles over the earth, remain over one spot 1980s – the decade of the satellite
Doppler radar images from the Oklahoma City radar May 4, 1999 Moore, OK F5 tornado Reflectivity Velocity Green = toward the radar, Red = away Intensity key 1990s – the decade of the radar
Compare the radar of the past to today’s…. …And this regional image which was captured during the June 29, 2012 derecho This 1944 thunderstorm image looked quite similar to what offices were using almost fifty years later in 1992…
2000s and 2010s (so far) – the decade(s) of the computer In the early 2000s, the NWS made a quantum leap in how forecasters looked at data to make forecasts/look at radar/many other products. AWIPS integrated all of the models/surface data/radar/satellite/lightning/hydrology. Instead of needing multiple display systems, now there was one.
Lightning in purple AWIPS allows forecasters to have multiple windows of model guidance and real time information! This is a satellite image from the remnants of Sep 2004 Hurricane Ivan (40 tornadoes in VA that day – a record!) with surface observations overlaid. In the upper left window is a radar image.
Computer models, which for decades had been static, could now be manipulated by forecasters. Different parameters could be highlighted, models could be overlaid for comparison, and different layers of the atmosphere seen. And finally – the images were incolor.
The balloon information received on the morning of the Feb 6, 2010 snowstorm Temperature trace Dewpoint (moisture) Wind speed and direction One of our incredibly dedicated staff who take launch those balloons in all types of weather The observations taken by the weather balloon paint a picture of the upper atmosphere: the temperature, moisture content, and winds. The information obtained by the balloons globally is fed into computers that create the weather models used by forecasters.
Upper Air Data Surface Observations Satellite Data Radar Data Model Guidance What Goes Into Today’s Forecast? Forecaster experience/knowledge is the MOST IMPORTANT thing that goes into a forecast.
Making the Forecast Some of the elements that we forecast: Temperature/Dewpoint Visibility Sky cover/cloud height Wind Speed/Direction Probability of Precipitation Amount of Rain/Snow Type of Weather : (Rain/Snow/Freezing Rain/ Thunder/Fog) Wave Height We use computer tools to draw gridded forecasts for all of these parameters. We take area-specific effect into account, such as the elevation of the Highlands and Shenadoah National Park (over 3000’) and the waters of the Chesapeake Bay.
Each county in our forecast area is its own forecast zone. AWIPS takes all of the gridded parameters the meteorologist has compiled, and software converts the images into a worded forecast Pictures to Words…
The gridded database allows any person with a computer to receive a forecast for their specific location – just mouse over a spot and click
The “point and click” forecast. You can get this for any location in the country, start from weather.gov
weather.gov/washington or weather.gov/baltimore • Latest Watches/Warnings/ Advisories • Hazardous Weather Outlook • Local Forecast Also check out http://mobile.weather.gov (geared for cell phone browsers)
MARINE FORECASTSWe issue wind, wave and weather forecasts for the Potomac River and Chesapeake Bay
And aviation forecasts at six airports including BWI, Washington National, and Dulles comprising cloud height and coverage, wind speed and direction, visibility, and any significant weather
Questions? Wrangell-St. Elias National Park, June 2012