Download
1 / 1
10 likes | 95 Views
4A. dCPI vs L STG/UPP STS. 4B. dCPI vs L LOW STS/MTG. BOLD Change (arbitrary units). BOLD Change (arbitrary units). 4D. dCPI vs L PT. 4C. dCPI vs R LOW STS/MTG. FIG 3: Group Activation Map, P > NP. BOLD Change (arbitrary units). BOLD Change (arbitrary units). L. R.

E N D
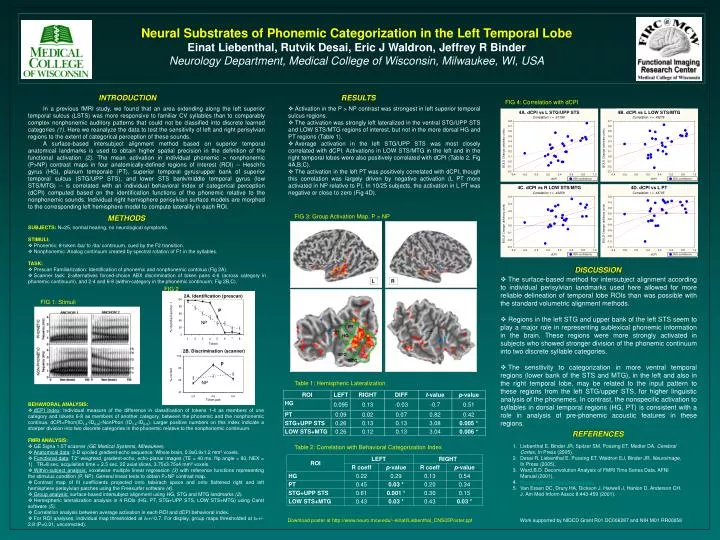
4A. dCPI vs L STG/UPP STS 4B. dCPI vs L LOW STS/MTG BOLD Change (arbitrary units) BOLD Change (arbitrary units) 4D. dCPI vs L PT 4C. dCPI vs R LOW STS/MTG FIG 3: Group Activation Map, P > NP BOLD Change (arbitrary units) BOLD Change (arbitrary units) L R 2A. Identification (prescan) P NP PT HG 2B. Discrimination (scanner) STG P MTG NP Neural Substrates of Phonemic Categorization in the Left Temporal Lobe Einat Liebenthal, Rutvik Desai, Eric J Waldron, Jeffrey R Binder Neurology Department, Medical College of Wisconsin, Milwaukee, WI, USA INTRODUCTION RESULTS FIG 4: Correlation with dCPI In a previous fMRI study, we found that an area extending along the left superior temporal sulcus (LSTS) was more responsive to familiar CV syllables than to comparably complex nonphonemic auditory patterns that could not be classified into discrete learned categories (1). Here we reanalyze the data to test the sensitivity of left and right perisylvian regions to the extent of categorical perception of these sounds. A surface-based intersubject alignment method based on superior temporal anatomical landmarks is used to obtain higher spatial precision in the definition of the functional activation (2). The mean activation in individual phonemic > nonphonemic (P>NP) contrast maps in four anatomically-defined regions of interest (ROI) -- Heschl’s gyrus (HG), planum temporale (PT), superior temporal gyrus/upper bank of superior temporal sulcus (STG/UPP STS), and lower STS bank/middle temporal gyrus (low STS/MTG) -- is correlated with an individual behavioral index of categorical perception (dCPI) computed based on the identification functions of the phonemic relative to the nonphonemic sounds. Individual right hemisphere perisylvian surface models are morphed to the corresponding left hemisphere model to compute laterality in each ROI. • Activation in the P > NP contrast was strongest in left superior temporal sulcus regions. • The activation was strongly left lateralized in the ventral STG/UPP STS and LOW STS/MTG regions of interest, but not in the more dorsal HG and PT regions (Table 1). • Average activation in the left STG/UPP STS was most closely correlated with dCPI. Activations in LOW STS/MTG in the left and in the right temporal lobes were also positively correlated with dCPI (Table 2, Fig 4A,B,C). • The activation in the left PT was positively correlated with dCPI, though this correlation was largely driven by negative activation (L PT more activated in NP relative to P). In 10/25 subjects, the activation in L PT was negative or close to zero (Fig 4D). METHODS SUBJECTS: N=25, normal hearing, no neurological symptoms. STIMULI: • Phonemic: 8-token /ba/ to /da/ continuum, cued by the F2 transition. • Nonphonemic: Analog continuum created by spectral rotation of F1 in the syllables. • TASK: • Prescan Familiarization: Identification of phonemic and nonphonemic continua (Fig 2A). • Scanner task: 2-alternatives forced-choice ABX discrimination of token pairs 4-6 (across category in phonemic continuum), and 2-4 and 6-8 (within-category in the phonemic continuum; Fig 2B,C). DISCUSSION • The surface-based method for intersubject alignment according to individual perisylvian landmarks used here allowed for more reliable delineation of temporal lobe ROIs than was possible with the standard volumetric alignment methods. • Regions in the left STG and upper bank of the left STS seem to play a major role in representing sublexical phonemic information in the brain. These regions were more strongly activated in subjects who showed stronger division of the phonemic continuum into two discrete syllable categories. • The sensitivity to categorization in more ventral temporal regions (lower bank of the STS and MTG), in the left and also in the right temporal lobe, may be related to the input pattern to these regions from the left STG/upper STS, for higher linguistic analysis of the phonemes. In contrast, the nonspecific activation to syllables in dorsal temporal regions (HG, PT) is consistent with a role in analysis of pre-phonemic acoustic features in these regions. FIG 2 FIG 1: Stimuli Table 1: Hemispheric Lateralization • BEHAVIORAL ANALYSIS: • dCPI Index: Individual measure of the difference in classification of tokens 1-4 as members of one category and tokens 6-8 as members of another category, between the phonemic and the nonphonemic continua. dCPI=Phon(ID1-4-ID6-8)-NonPhon(ID1-4-ID6-8). Larger positive numbers on this index indicate a sharper division into two discrete categories in the phonemic relative to the nonphonemic continuum. FMRI ANALYSIS: • GE Signa 1.5T scanner (GE Medical Systems, Milwaukee). • Anatomical data: 3-D spoiled gradient-echo sequence. Whole brain, 0.9x0.9x1.2 mm3 voxels. • Functional data: T2*-weighted, gradient-echo, echo-planar images (TE = 40 ms, flip angle = 90, NEX = 1). TR=8 sec, acquisition time = 2.5 sec. 22 axial slices, 3.75x3.75x4 mm3 voxels. • Within-subject analysis: voxelwise multiple linear regression (3) with reference functions representing the stimulus condition (P, NP). General linear tests to obtain P>NP contrast map. • Contrast map of fit coefficients projected onto talairach space and onto flattened right and left hemisphere perisylvian patches using the Freesurfer software (4). • Group analysis: surface-based intersubject alignment using HG, STG and MTG landmarks (2). • Hemispheric lateralization analysis in 4 ROIs (HG, PT, STG+UPP STS, LOW STS+MTG) using Caret software (5). • Correlation analysis between average activation in each ROI and dCPI behavioral index. • For ROI analyses, individual map thresholded at t=+/-0.7. For display, group maps thresholded at t=+/-2.8 (P<0.01, uncorrected). REFERENCES • Liebenthal E, Binder JR, Spitzer SM, Possing ET, Medler DA. Cerebral Cortex, In Press (2005). • Desai R, Liebenthal E, Possing ET, Waldron EJ, Binder JR. Neuroimage, In Press (2005). • Ward,B.D. Deconvolution Analysis of FMRI Time Series Data, AFNI Manual (2001). • http://surfer.nmr.mgh.harvard.edu • Van Essen DC, Drury HA, Dickson J, Harwell J, Hanlon D, Anderson CH. J.Am Med Inform Assoc 8:443-459 (2001). Table 2: Correlation with Behavioral Categorization Index Download poster at http://www.neuro.mcw.edu/~einatl/Liebenthal_CNS05Poster.ppt Work supported by NIDCD Grant R01 DC006287and NIH M01 RR00058