Download

1 / 27
270 likes | 367 Views
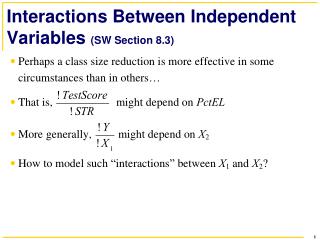
Factorial Analysis of Variance. More than 2 Independent Variables Between-Subjects Designs. What is a Factorial. At least two independent variables All combinations of each variable (completely crossed) R X C factorial Cells. Variables and Cells. 2 X 2 2 IVs 4 cells

E N D
Factorial Analysis of Variance More than 2 Independent Variables Between-Subjects Designs
What is a Factorial • At least two independent variables • All combinations of each variable (completely crossed) • R X C factorial • Cells
Variables and Cells • 2 X 2 2 IVs 4 cells • 2 X 3 2 IVs 6 cells • 2 X 3 X 3 3 IVs 18 cells • 2 X 2 X 2 X 2 4 Ivs 16 cells
Effects Tested • 2 X 2 A, B, A X B • 2 X 2 X 2 A, B, C, A X B, • A X C, B X C, A X B X C • 2 X 2 X 2 X 2 A, B, C, D, A X B, A X C, A X D, B X C, B X D, C X D, A X B X C, A X B X D, B X C X D, A X B X C X D
Video Violence • Bushman study • Two independent variables • Two kinds of videos • Male and female subjects • See following diagram
Bushman’s Study-cont. • Dependent variable = number of aggessive associates • 50 observations in each cell • We will work with means and st. dev., instead of raw data. • This illustrates important concepts.
Effects to be estimated • Differences due to videos • Violent appear greater than nonviolent • Differences due to gender • Males appear higher than females • Interaction of video and gender • What is an interaction? • Does violence affect males and females equally? Cont.
Estimated Effects--cont. • Error • average within-cell variance • Sum of squares and mean squares • Extension of the same concepts in the one-way
Calculations • Total sum of squares • Main effect sum of squares Cont.
Calculations--cont. • Interaction sum of squares • Calculate SScells and subtract SSV and SSG • SSerror = SStotal - SScells • or, MSerror can be found as average of cell variances
Degrees of Freedom • df for main effects = number of levels - 1 • df for interaction = product of dfmain effects • dferror = N - ab = N - # cells • dftotal = N - 1
Calculations for Bushman Data • SStotal requires raw data. • It is actually = 171.50 • SSvideo Cont.
Calculations--cont. • SSgender Cont.
Calculations--cont. • SScells • SSVXG = SScells - SSvideo - SSgender= 171.375 - 105.125 - 66.125 = 0.125 Cont.
Calculations--cont. • MSerror = average of cell variances =(4.62 + 3.52 + 4.22 + 2.82)/4 =58.89/4 = 14.723 • Note that this is MSerror and not SSerror
Conclusions • Main effects • Significant difference due to video • More aggressive associates following violent video • Significant difference due to gender • Males have more aggressive associates than females. Cont.
Conclusions--cont. • Interaction • No interaction between video and gender • Difference between violent and nonviolent video is the same for males (1.5) as it is for females (1.4) • We could see this in the graph of the data.
Elaborate on Interactions • Diagrammed on next slide as line graph • Note parallelism of lines • Means video differences did not depend on gender • A significant interaction would have nonparallel lines • Ordinal and disordinal interactions
Simple Effects • Effect of one independent variable at one level of the other. • e.g. Difference between males and females for only violent video • Difference between males and females for only nonviolent video
Unequal Sample Sizes • A serious problem for hand calculations • Can be computed easily using computer software • Can make the interpretation difficult • Depends, in part, on why the data are missing.
Magnitude of Effect • Eta Squared • Interpretation • Omega squared • Less biased estimate k = number of levels for the effect in question Cont.
Effect Size—cont. • As with one-way, we can calculate effect size for each kind of effect separately. • Most sensible to stick to comparisons of two groups. • Same formulae as for t tests.