Download
1 / 16
160 likes | 258 Views
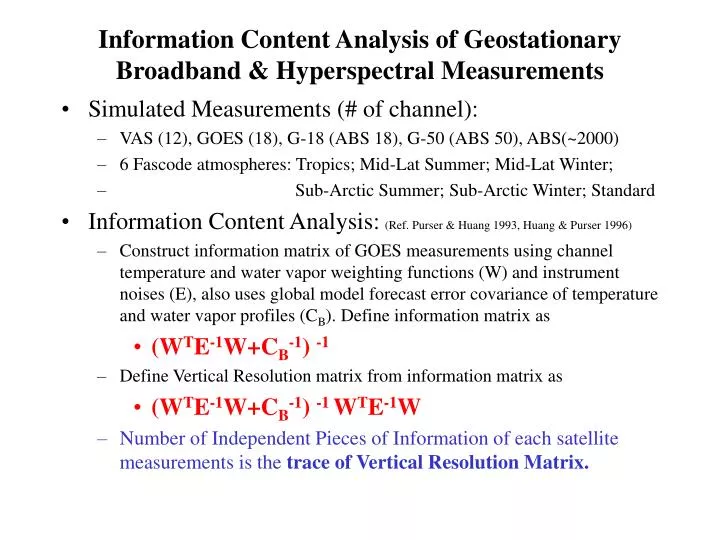
Information Content Analysis of Geostationary Broadband & Hyperspectral Measurements. Simulated Measurements (# of channel): VAS (12), GOES (18), G-18 (ABS 18), G-50 (ABS 50), ABS(~2000) 6 Fascode atmospheres: Tropics; Mid-Lat Summer; Mid-Lat Winter;

E N D
Information Content Analysis of Geostationary Broadband & Hyperspectral Measurements • Simulated Measurements (# of channel): • VAS (12), GOES (18), G-18 (ABS 18), G-50 (ABS 50), ABS(~2000) • 6 Fascode atmospheres: Tropics; Mid-Lat Summer; Mid-Lat Winter; • Sub-Arctic Summer; Sub-Arctic Winter; Standard • Information Content Analysis:(Ref. Purser & Huang 1993, Huang & Purser 1996) • Construct information matrix of GOES measurements using channel temperature and water vapor weighting functions (W) and instrument noises (E), also uses global model forecast error covariance of temperature and water vapor profiles (CB). Define information matrix as • (WTE-1W+CB-1) -1 • Define Vertical Resolution matrix from information matrix as • (WTE-1W+CB-1) -1 WTE-1W • Number of Independent Pieces of Information of each satellite measurements is the trace of Vertical Resolution Matrix.
ABS Prime (ABS’) -- consider using the shortwave side of the water vapor band.
100 100 Advanced Sounder (3074) GOES (18) Pressure (hPa) Pressure (hPa) 1000 1000 Moisture Weighting Functions High spectral resolution advanced sounder will have more and sharper weighting functions compared to current GOES sounder. Retrievals will have better vertical resolution. UW/CIMSS
GIFTS and GOES Temperature Information Content Analysis GIFTS Vert-Res.: 1-2 Km GOES Vert-Res.: 3-5 Km Current - GOES GIFTS ~3 Pieces 10-12 Pieces
GIFTS and GOES Water Vapor Information Content Analysis GIFTS Vert-Res.: 2-4 Km GOES Vert-Res.: 6-8 Km Current - GOES GIFTS ~2 Pieces 8-9 Pieces
Information Content Analysis of GOES Single FOV Measurements - Results • Temperature (0.1-1050 mb) Independent Pieces of Information for GOES and ABS ~ 2000 channel & noise of 0.3 K NEdT (@250 K) measurements • Classes# of Pieces of Information • GOESABS • Tropics 4.3 15.1 • Mid-Lat-Summer 3.9 14.3 • Mid-Lat-Winter 3.0 13.6 • Sub-Arctic-Summer 3.3 13.7 • Sub-Arctic-Winter 2.9 13.9 • Global Mean 3.5 14.1
Information Content Analysis of GOES Single FOV Measurements - Results • Water Vapor (0.1-1050 mb) Independent Pieces of Information for GOES and ABS ~ 2000 channel & noise of 0.25 K NEdT (@250 K) measurements • Classes# of Pieces of Information • GOESABS • Tropics 1.9 6.3 • Mid-Lat-Summer 1.9 6.3 • Mid-Lat-Winter 2.5 9.8 • Sub-Arctic-Summer 2.6 6.9 • Sub-Arctic-Winter 1.9 10.6 • Global Mean 2.2 8.0
Information Content Analysis of RAOB Measurements • NOAA 88 Global RAOB Measurements (# of profiles): • 5505 profiles, 1988 , 4 seasons, Land & Ocean, Day & Night • Mid-Lat Summer (1071), Mid-Lat Winter (1072), Tropics (1085) • Sub-Arctic Summer (1250), Sub-Arctic Winter (1027) • Information Content Analysis - Eigenvector Decomposition • Obtain eigenvectors from five classes’ of temperature (150-1013 mb) and water vapor (300-1013 mb) profiles separately. • Obtain truncated temperature (water vapor) profile to the residual level of 0.25K (3%). The limited number (< total number of vector) of eigenvector used is considered as the number of independent pieces of information possesses by the RAOB measurements. • Number of Independent Pieces of Information of RAOB temperature and water vapor measurements is defined as the mean value of number of truncated vectors used that gives the residual error of reconstructed profiles within the RAOB measurement noise for each five classes.
Information Content Analysis of RAOB Single Profile Measurements - Results • Temperature Independent Pieces of Information for 150-1013 mb, and RAOB accuracy of ~ 0.3 K error • Classes# of Pieces of InformationResidual Error (K) • Tropics 15 0.17 • Mid-Lat-Summer 16 0.33 • Mid-Lat-Winter 16 0.25 • Sub-Arctic-Summer 13 0.29 • Sub-Arctic-Winter 13 0.29 • Global Mean 15 0.27
Information Content Analysis of RAOB Single Profile Measurements - Results • Water Vapor Independent Pieces of Information for 300-1013 mb, and RAOB accuracy of ~ 3 % error • Classes# of Pieces of InformationResidual Error (%) • Tropics 11 3.0 • Mid-Lat-Summer 10 3.0 • Mid-Lat-Winter 9 3.0 • Sub-Arctic-Summer 9 3.1 • Sub-Arctic-Winter 10 3.1 • Global Mean 10 3.0
Information Content Analysis of RAOB Single Profile Measurements - Results • Water Vapor Independent Pieces of Information for 300-1013 mb, and RAOB accuracy of ~ 3 % error • Classes# of Pieces of InformationResidual Error (%) • Tropics 11 3.0 • Mid-Lat-Summer 10 3.0 • Mid-Lat-Winter 9 3.0 • Sub-Arctic-Summer 9 3.1 • Sub-Arctic-Winter 10 3.1 • Global Mean 10 3.0
Information Content of Geo-Sounders Vs. Radiosonde Infrared Sounders & Radiosonde
Temperature Information Content ComparisonGeo Sounder Vs. Radiosonde • Per day, CONUS (25-50 N; 68-128 W) • Assume 30 % of cloud free FOVs (10 km) for Geo • Temperature Information per Day (TI/Day): • GOES - 24 hr/day x 30,000 fov/hr x 30% x 3.5 TI/fov = 2,520K TI/Day • ABS - 24 hr/day x 30,000 fov/hr x 30% x 14.1TI/fov = 10,152K TI/Day • RAOB - 2 hr/day x 100 profile/hr x 15 TI/profile = 3K TI/Day • Conclusion: • GOES has 2,520K/3K=840 times of RAOB information • ABS has 10,152K/3K=3384 times of RAOB information
Water Vapor Information Content ComparisonGeo Sounder Vs. Radiosonde • Per day, CONUS (25-50 N; 68-128 W) • Assume 30 % of cloud free FOVs (10 km) for Geo • Water Vapor Information per Day (WVI/Day): • GOES - 24 hr/day x 30,000 fov/hr x 30% x 2.2 TI/fov = 1,584K WVI/Day • ABS - 24 hr/day x 30,000 fov/hr x 30% x 8 TI/fov = 5,760K WVI/Day • RAOB - 2 hr/day x 100 profile/hr x 10 TI/profile = 2K WVI/Day • Conclusion: • GOES has 1,584K/2K=792 times of RAOB information • ABS has 5,760K/2K=2880 times of RAOB information