Download
1 / 7
80 likes | 229 Views
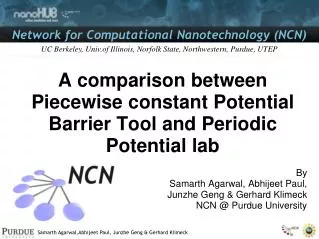
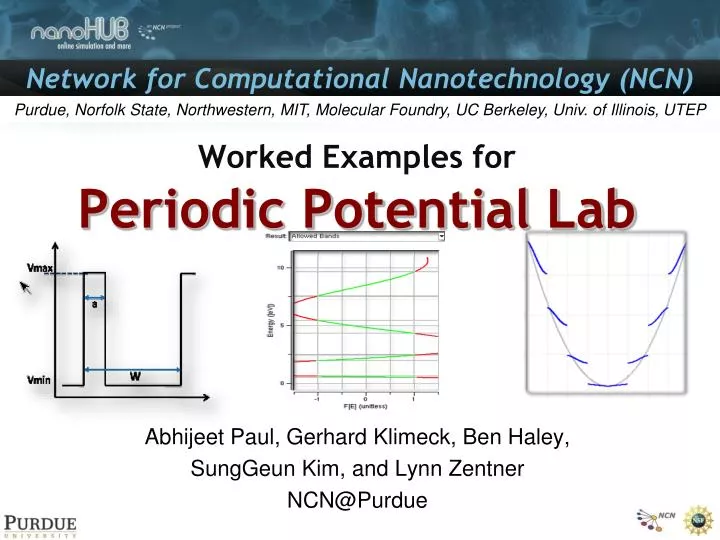
Worked Examples for Periodic Potential Lab. Abhijeet Paul, Gerhard Klimeck, Ben Haley, SungGeun Kim, and Lynn Zentner NCN@Purdue. Simulation Example [1] :Variation of well width. Task : Study the effect of W on electronic band-structure. Input details : Well Type : Step well a = 1 Ǻ

E N D
Worked Examples forPeriodic Potential Lab Abhijeet Paul, Gerhard Klimeck, Ben Haley, SungGeun Kim, and Lynn Zentner NCN@Purdue
Simulation Example [1] :Variation of well width Task : Study the effect of W on electronic band-structure Input details : Well Type : Step well a = 1 Ǻ W = [2 , 4, 6, 8, 10] Ǻ mpar = 1*mo Vmin = 0 eV Vmax = 10 eV Epar = [0-12] eV E_sample_pts = 100 This problem is similar to particle in a box with periodic boundary conditions. All images from Periodic Potential Lab on nanoHUB.org
Simulation Example [1] :Variation of well width Real solution variation with well width W. What is expected ? W=4 • As W increases E decreases. • More energy bands expected in the well. W=2 F(E) [unitless] W=8 W=6 W=10 mo = 9.1e-31kg Energy[eV]
Simulation Example [2] :Variation of well width Lowest energy band for different well widths. E(min) ~ 1/W2 Bandwidth W=2 W=10 W=4 W=6 W=8 Table showing some of the important band parameters All images from Periodic Potential Lab on nanoHUB.org
Simulation Example [3] :Variation in particle mass Task : Study the effect of mpar on electronic band-structure Input details : Well Type : Step well a = 1 Ǻ W = 8 Ǻ mpar = [0.25,0.5,1,1.5,2]*mo Vmin = 0 eV Vmax = 10 eV Epar = [0-12] eV E_sample_pts = 100 All images from Periodic Potential Lab on nanoHUB.org
Simulation Example [3] :Variation in particle mass Real solution variation with well width W. mpar =0.25 mpar =0.5 mpar =1.0 Heavy particles move slowly through the barrier and hence produce more bands in the well. Also the energy minimum gets smaller. mpar =1.5 mpar =2.0 More bands for heavier mass. mo = 9.1e-31kg
Simulation Example [3] :Variation in particle mass m=2.0 m=1.5 m=1.0 m=0.50 m=0.25 Table showing some of the important band parameters Transmission of a particle through the well. A heavier particle has limited transmission. A lighter particle easily passes through the barrier. All images from Periodic Potential Lab on nanoHUB.org