Download
1 / 22
220 likes | 324 Views
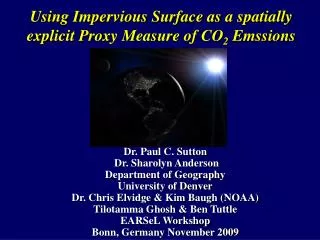
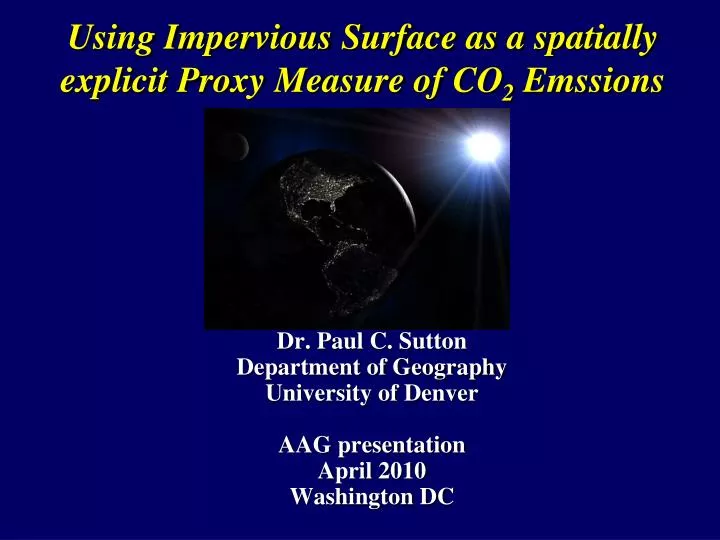
Using Impervious Surface as a spatially explicit Proxy Measure of CO 2 Emssions. Dr. Paul C. Sutton Department of Geography University of Denver AAG presentation April 2010 Washington DC. Outline. Brief overview of DMSP OLS nighttime lights data product

E N D
Using Impervious Surface as a spatially explicit Proxy Measure of CO2 Emssions Dr. Paul C. Sutton Department of Geography University of Denver AAG presentation April 2010 Washington DC
Outline • Brief overview of DMSP OLS nighttime lights data product • Mapping & Estimating Impervious Surface • Multiple Regression using Landscan Population and Nighttime Lights • Validation using High Resolution Aerial Photography • Brief overview of gridded CO2 emission data for U.S. • Vulcan CO2 data • http://www.purdue.edu/eas/carbon/vulcan/index.php • Correlation Analysis of ISA and DMSP with CO2 emissions • Sources: Commercial, Cement, Industrial, Mobile, Residential, Utilities, Aircraft, Non-Road transportation, Total • Scales: 10 km, 20 km, 30 km, 50 km, 100 km (1 degree x 1 degree) • Mapping & Monetization of National Ecological Deficits and Surpluses • Regression Model, Error Pattern, Global estimates
The Satellite SystemDefense Meteorological Satellite Program Operational LineScan System (DMSP OLS) Two sun-synchronous polar orbiting satellites (865 km orbit) Observations at 1) ~ Dawn & Dusk, 2) ~ Noon & Midnight Pixel Size: smoothed ~2.4 km2, fine ~ 0.5 km2, Swath Width ~3000 km Two Bands: 1) Panchromatic VNIR, 2) Thermal Infrared Dynamic Range: VNIR more than 4 orders of magnitude larger than traditional sensors optimized for daytime observation (e.g. sees light from reflected moonlight to reflected sunlight) Data available from early 1970’s to Present, Digital Archive est. in 1992 Data Products derived from imagery (hyper-temporal mosaicing): % cloud cover, % light observed, Fires, Lantern Fishing, Gas Flares, City Lights, Radiance Calibrated City Lights, Atmospherically corrected radiance calibrated city lights
Example of Cloud Screening over Italy VNIR over Italy Thermal over Italy
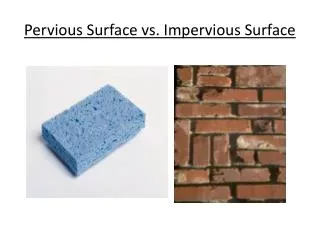
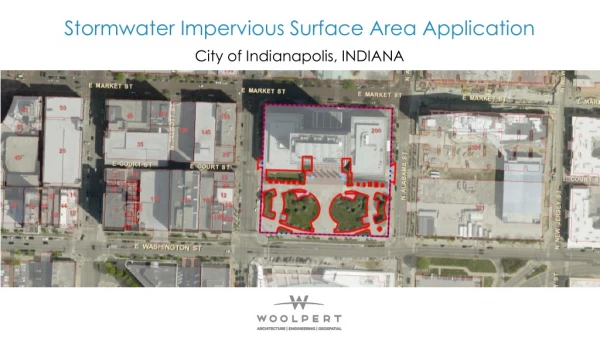
Impervious Surface Area (ISA) Data Product for Conterminous United States
New Question: How good a Proxy is ISA or Nighttime lights for CO2 Emissions? Data Source: Spatially Explicit Accounting of CO2 emission sources obtained from The Vulcan Project http://www.purdue.edu/eas/carbon/vulcan/index.php CO2 Emissions Tons of CO2 emitted Per year per 10 x 10 km Grid Cell
CO2 Emissions Mapfrom Mobile Sources 423,140,828 Tons of Carbon Per Year ~28% of Total U.S. CO2 emissions
CO2 Emssions Mapfrom Utilities 586,694,308 Tons of Carbon Per Year ~39% of Total U.S. CO2 emissions
Aggregate ALL Datasets to Several Spatial Scales ~20 km x ~20 km grid cells ~30 km x ~30 km grid cells ~50 km x ~50 km grid cells 1 degree x 1 degree km grid cells
Correlation Matrix Assessed for all Scales • 10 km x 10 km • 20 km x 20 km • 30 km x 30 km • 50 km x 50 km • 1º x 1º
These Models are applied Globally Note: A global product was generated using both DMSP OLS and Landscan Population Data
Using 10 km Resolution Lightsaggregated to Nations in Ln vs. Ln (Not very satisfying….)
Summary & Conclusions • Nighttime Lights and derived Data products such as ISA (Impervious Surface) are significant proxy measures of CO2 emissions. • However, They are better proxies of some forms of CO2 emissions than others (transportation yes, Cement not so much) • U.S. parameterization may not generalize well to other nations. • “Several Error prone measures are better than one”