Download
1 / 14
140 likes | 308 Views
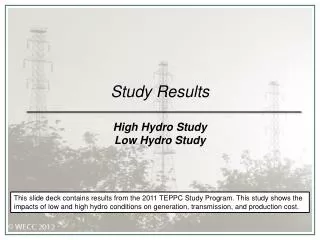
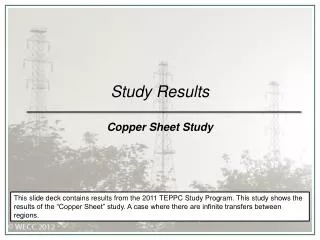
Study Results High Load Study. This slide deck contains results from the 2012 TEPPC Study Program. This study shows the resulting transmission impacts when WECC-wide loads are increased 8%. Study Concept Central Question:

E N D
Study ResultsHigh Load Study This slide deck contains results from the 2012 TEPPC Study Program. This study shows the resulting transmission impacts when WECC-wide loads are increased 8%.
Study Concept Central Question: What will be the impact on transmission if the load is increased in 2022 as compared to the Common Case. Change to starting input assumptions: Loads – Increased by 8% Transmission System – None Generation – Over 117,000 MW CTs are added to the system Goal Understand the impact of an 8% increase in WECC-wide load on generation and transmission utilization. 2022 PC1-5 High Load Study Summary
Increase WECC-wide load 8% 1 8% 8% increase to peak and energy 10% 10% decrease to energy This case is not meant to be RPS compliant
1- Check PRM 2 - Add CTs (if needed) = Higher load and new resources
PC1-5 High Load PRM Gap 1) Added CTs in 100 MW increments to make up this 11,426 MW PRM Gap 2) CT’s were adjusted in Renewable Options Under High Load studies
Higher loads caused a higher Annual Average hub LMP throughout the Western Interconnection as compared to the Common Case.
What is different? Loads Transmission Resources
Changes in Path Utilization P01 Alberta-British Columbia Table 2 Greatest change in path utilization P03 Northwest-British Columbia P11 West of Crossover P08 Montana - Northwest P66 COI P26 Northern-Southern California P47 Southern New Mexico (NM1) P45 SDG&E-CFE*
Less congestion than Common Case More utilization, Equal congestion as the Common Case
Less utilization than the Common Case Less congestion, utilization than the Common Case
Less congestion, utilization than Common Case Less path flow than Common Case