Download
1 / 16
160 likes | 357 Views
Supplemental Materials: Anti-apoptotic BCL-2 family proteins as 5-Azacytidine sensitizing targets and determinants of response in myeloid malignancies. BCL-X L siRNA Drug Dose Response Curves. Supplementary Figure 1A. Supplementary Figure 1B,C. B. TF-1.

E N D
Supplemental Materials:Anti-apoptotic BCL-2 family proteins as 5-Azacytidine sensitizing targets and determinants of response in myeloid malignancies
BCL-XL siRNA Drug Dose Response Curves Supplementary Figure 1A
Supplementary Figure 1B,C B TF-1 9 25 48 78 time (h) siRNA NS XL NS XL NS XL NS XL BCL-XL -Tubulin C THP-1 9 25 48 78 time (h) siRNA NS XL NS XL NS XL NS XL BCL-XL -Tubulin Supplementary Figure 1. BCL-XL siRNA treatment of AML-derived cell lines. (A) BCL-XL siRNA drug dose response assays with 5-Azacytidine in vitro. Cell lines are listed at the top of each response curve plotting % viability (relative cell number) against the log of the 5-Azacytidine molar dose. Buffer treated wells received diluted transfection reagent but no siRNA, non-silencing wells received a siRNA with no known mRNA targets. Leftward curve shifts indicate 5-Azacytidine sensitization. (B, C) siRNA knock-down time course. Extracts from TF-1 (B) and THP-1 (C) treated with non-silencing (NS) and BCL-XL (XL) siRNA were prepared at 9, 25, 48 and 78 hours post-transfection and probed by western blotting.
Supplementary Figure 2A 5-Aza + ABT-737 5-Aza + ABT-199
Supplementary Figure 2A continued 5-Aza + ABT-737 5-Aza + ABT-199
Supplementary Figure 2A continued 5-Aza + ABT-737 5-Aza + ABT-199
Supplementary Figure 2B ABT-737 MDS- L ABT-199 5-Aza [µM] 5-Aza [µM] 5-Aza [µM] 5-Aza [µM] 5-Aza [µM] 5-Aza [µM] ABT-1737 [nM] ABT-199 [µM] ABT-199 [µM] ABT-737 [nM] ABT-199 [nM] ABT-737 [nM] ABT-737 HL-60 ABT-199 ABT-737 ML-2 ABT-199
Supplementary Figure 2B continued 5-Aza [µM] 5-Aza [µM] 5-Aza [µM] 5-Aza [µM] ABT-737 THP-1 ABT-199 ABT-737 [nM] ABT-199 [µM] ABT-737 [nM] ABT-199 [µM] ABT-737 TF-1 ABT-199
Supplementary Figure 2B continued ABT-737 M07e ABT-199 5-Aza [µM] 5-Aza [µM] 5-Aza [µM] 5-Aza [µM] ABT-737 [nM] ABT-737 [nM] ABT-199 [µM] ABT-199 [µM] ABT-737 SET-2 ABT-199
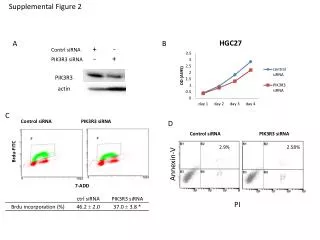
Supplementary Figure 2. ABT-737 versus ABT-199 combination with 5-Azacytidine in vitro. (A) Seven to nine doses of 5-Azacytidine spanning a broad range from 0 to 100% reduction in viability are shown in combination with six doses of ABT-737 (left panel), compared to nine doses of 5-Azacytidine spanning a broad range from 0 to 100% reduction in viability with six doses of ABT-199 (right panel). A leftward shift of the 5-Azacytidine dose response curve with the addition of the corresponding ABT-737 or ABT-199 dose indicates 5-Azacytidine sensitization. (B) Combination Index values (CI) versus fractional effect (FE) plots are shown side-by-side for ABT-737 (left panel) and ABT-199 combination with 5-Azacytidine (right panel). CI values < 0.8 indicate synergy. The numbers in the tables correspond to the specific dose combinations shown on the CI versus FE plots. (C, D) Combination treatment with 5-Azacytidine + ABT-737 resulted in increased levels of cleaved caspase 3 (CC3), compared to either treatment alone. The y-axis shows the percentage of the cell population positive for CC3 signal by flow cytometry for the given treatment on the x-axis. (C) TF-1 cells were pre-treated with ABT-737 for 24h followed by 5-Azacytidine treatment for an additional 48h prior to fixation for CC3 analysis by flow cytometry. (D) HL-60 cells were treated with ABT-737 and 5-Azacytidine simultaneously for 8, 24 and 48h prior to fixation for CC3 measurement.
Supplementary Figure 3 Supplementary Figure 3. MCL-1 siRNA + ABT-737 drug dose response in vitro. Cell lines are listed at the top of each response curve plotting % viability (relative cell number) against the log of the ABT-737 molar dose. Buffer treated wells received diluted transfection reagent but no siRNA, non-silencing wells received a siRNA with no known mRNA targets. The most effective MCL-1 siRNA sequence (s6) was selected from previous siDDR experiments shown in Table 1A, B. Leftward curve shifts indicate ABT-737 sensitization by MCL-1 siRNA.
Supplementary Figure 4A BCL-XL MCL-1 BCL-2
Supplementary Figure 4B,C BCL-XL mRNA Expression in AML B C Valk, Oncomine Metzeler2, Oncomine 0. No value (19) 1. FAB Subtype M0 (6) 2. FAB Subtype M1 (63) 3. FAB Subtype M2 (66) 4. FAB Subtype M3 (19) 5. FAB Subtype M4 (53) 6. FAB Subtype M5 (64) 7. FAB Subtype M6 (3) 0. No value (1) 1. FAB Subtype M0 (1) 2. FAB Subtype M1 (23) 3. FAB Subtype M2 (34) 4. FAB Subtype M4 (11) 5. FAB Subtype M5 (6) 6. FAB Subtype M6 (3) Supplementary Figure 4. Oncomine BCL-XL mRNA expression in primary AML samples by FAB classification. (A) mRNA expression by AML FAB classification of public datasets GEO accession numbers: GSE19429, GSE6891, GSE12417. (B) Oncomine, Valk mRNA expression. (C) Oncomine, Metzeler2 mRNA expression. For B and C, the number of primary specimens for each AML FAB classification is shown in parentheses.
Supplementary Figure 5 p=0.0011 p=0.0011 p=0.022 no response response no response response no response response Supplementary Figure 5. BH3 profiling discriminates 5-Azacytidine response in vitro. Response to 5-Azacytidine (N=13 AML-derived cell lines) is plotted against % priming as determined by BH3 profiling for the BH3 peptides indicated above each plot.
Supplementary Table 1 Clinicopathologic variables (5-Azacytidine treated patients) Supplementary Table 1. Clinicopathologic variables of clinical specimens used for BH3 profiling.