Download
1 / 54
540 likes | 619 Views
The Public Health Prescription for Walkable Communities. Deb Spicer NYS Department of Health Healthy Heart Program. Impact of Transportation and Land Use Patterns on Health . Physical Activity and Obesity Asthma Injuries Loss of Function in Older Adults Heart Attacks.

E N D
The Public Health Prescription for Walkable Communities Deb Spicer NYS Department of Health Healthy Heart Program
Impact of Transportation and Land Use Patterns on Health • Physical Activity and Obesity • Asthma • Injuries • Loss of Function in Older Adults • Heart Attacks
Underlying Causes of Death (US) While most of the preventable causes of death declined, diet and physical inactivity increased 33%.
Obesity Trends* Among U.S. AdultsBRFSS, 2002 (*BMI ≥30, or ~ 30 lbs overweight for 5’ 4” woman) (*BMI 30, or ~ 30 lbs overweight for 5’4” person) No Data <10% 10%–14% 15%–19% 20%–24% ≥25% Source: Behavioral Risk Factor Surveillance System, CDC
1990 1995 2001 No Data <4% 4%-6% 6%-8% 8%-10% >10% Diabetes Trends* Among Adults in the U.S., (Includes Gestational Diabetes) BRFSS, 1990,1995 and 2001 Source: Mokdad et al., Diabetes Care 2000;23:1278-83; J Am Med Assoc 2001;286:10.
Overweight and Obesity Among NYS Adults (2003 BRFSS) 56% of NY Adults are Overweight or Obese
Obesity Among NYS Adults, By Ethncity2003, BRFSS 68% 58% 55%
Trends in Overweight and Obesity Among NYS Adults, BRFSS 57% 42%
Obesity Rates by Ethnicity and Gender, US, NHANES 1999-2000 • Based on actual height and weight measurements (BRFSS is self-reported) • Rate among AA women predicted to be 57% by 2010.
Estimated Medical Costs of Obesity in NYS 25% of increase in health care costs due to obesity
Current Recommendations for Physical Activity • Adults • At least 30 minutes a day of Moderate activity, at least 5 days a week. • Can be in 10 minute segments • Elementary-Age Children • accumulate at least 60 minutes of activity on all or most days of the week • up to several hours of intermittent activity every day
What’s Moderate Activity? • Brisk walking (3-4.5 mph) • Bicycling - on level terrain • Playing frisbee • Swimming - recreational (doesn’t have to be laps) • Dancing - anything but slow • Coaching a sport • Handling uncooperative young child (chasing, dressing, etc.)
Through 2000 Two most frequent types of leisure Time/day; days/week Appox 26% met recommendations No leisure time PA After 2001 Moderate (other than work); days/week, total time/day. Same with vigorous Approx. 45% met recommendations No leisure time PA BRFSS Questions on Physical Activity
Percent of Adults With No Leisure Time Physical Activity 2001, BRFSS
Cost of Physical Inactivity in NYS • Inactivity costs NYS $3 billion a year • A 5% increase in physical activity rates in adults would save NY $180 million a year. • Inactive adults have $330 more per year in direct medical costs than active adults (in 1987 dollars).
Health Benefits of Walking • 3 hrs/wk of brisk walking (3mph) reduced heart disease risk in women by 35-40% • Older adults who walked at least 4 hrs/week were 31% less likely to be hospitalized for heart disease or stroke. • Women who walked at least 1 hr/wk reduced risk of CHD by 50%.(amount more important than pace)
Health Benefits of Walking • People with diabetes who walked for exercise at least 2 hours a week lowered their mortality rate from all causes by 39 percent. • Older women who walked the most had 40% less cognitive decline over 6-8 years.
Successful Long Term Weight Loss • National Weight Control Registry • Lost 66 pounds and maintained for 5.5 years • During weight loss: • 89% used both diet and activity • 92% exercised at home • During maintenance • walking most common type of activity
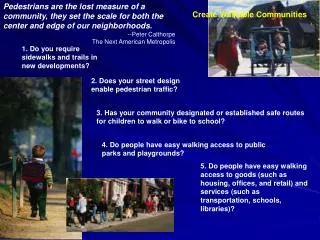
Why Don’t We Walk • No place to walk • Can’t cross the street • Too far • Unpleasant • Dangerous • Time
Average Annual Hospitalization Costs for Motor Vehicle Injuries, NYS, 1994-96
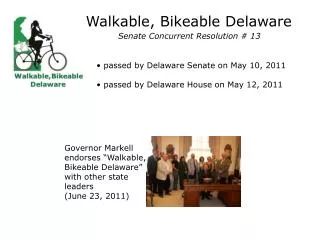
Healthy People 2010 Objectives • to at least 25% the percentage of trips of 1 mile or less that adults make by walking. • to at least 50% the percentage of trips to school (less than 1 mile) that youth make by walking
Making it easier to be active = Environmental Changes : • Sidewalks and shoulders along roadways • Destinations to walk and bike to • Community trails - for walking, bicycling, in-line skating, pushing a stroller. • Safe neighborhood playgrounds and parks for kids and adults • Schools and malls open for walking • Attractive, well lit stairwells
Guide to Community Preventive Services – Promoting Physical Activity • Insufficient Evidence • Classroom-based health education • Mass media (alone) • College health ed and PE • Family-based social support • Physician counseling
Guide to Community Preventive Services – Promoting Physical Activity • Recommended • Community-scale urban design and land use policies * • Street-scale urban design* • Community wide campaigns • PE • Social Support Interventions • Individually adapted health behavior change programs • More opportunities for PA *to be published, fall 2004
Switzerland • Over 60% of adults meet PA recommendations • Daily commuting • 32% walk (NY - 7%) • 14% bicycle (NY - <1%) • 20,000 miles of signed walking trails • 8 major bike routes (in a small country) • Town centers with pedestrian only zones • Bikes allowed on trains and buses Source: Switzerland Federal Office of Sports
Impact of Environmental ChangesStair Use - 2000 • Baltimore subway station • Observed 10,700 commuters (54% AA) choice of stairs or escalator • Intervention: culturally specific sign - “No time for exercise? Try the stairs” • Results: Increased stair use among AA from 10.2% to 16.2%.
Impact of Environmental ChangesTrail Use - 2000 • Telephone survey of adults in 12 rural counties in Missouri • Trails associated with 8% overall increase in physical activity. • Of those with access to a trail - 21% reported increased activity. • Increase more likely among women, those with less education.
Sprawl and Health Ewing, 2003
Impact of Environment on Physical Activity in North Carolina (2003) Huston, AJHP, 2003
Destinations and Physical Activity in Older Women in Pittsburgh(2003) King, AJHP, 2003
Obesity and Community DesignAtlanta, 2004 • Land use mix, residential density, street connectivity • Land use mix most strongly correlated with obesity • ↑ 1 quartile → ↓ obesity risk by 12% • ↑ car time by 1 hour → ↑ obesity by 6% • ↑ walk by 1 km/day →↓obesity by 5% Frank, AJPM, 2004
Asthma and Traffic • Atlanta - Summer Olympic Games, 1996, Reduced auto use by 22.5% • Reduced hospitalizations for asthma by 41.6% among children 1-16 years old • Erie County, 1990-1993. • Children living within 200 m of state road 2x as likely to be hospitalized for asthma
Neighborhood Environment and Loss of Physical Function in Older Adults • Alameda County, CA; 55+; healthy at start, followed for 1 year; rated neighborhoods • Living in problem neighborhoods - 2x as likely to have loss of overall function and 3x as likely to have loss of leg function. • Noise, inadequate lighting and heavy traffic created highest risk.
Other Benefits of Walkable Communities • Less reliance on cars – less traffic congestion, air pollution, noise • Less crime – “Eyes on the street”, CPTED • Better sense of community • Economic benefits • More independence for youth, seniors, people with disabilities, poor.
The Vision • A Walkable Community is one where, on a hot summer’s day, a couple of 8-year old children can walk by themselves to a corner grocery store to get a popsicle.
Components of Walkable Communities • Safe places to walk - sidewalks, shoulders, trails (engineering) • Safe crossings - crosswalks, medians, signals, street design (engineering) • Pleasant environs • Safer driver and pedestrian behavior - (enforcement, education) • Safe neighborhood (enforcement)
Components of Walkable Communities (cont) • Traffic calming - narrow streets, on-street parking, trees, medians (engineering) • Destinations - mixed land use, higher density housing, infill develop.,location of schools and parks, vibrant downtowns • Attitudes - accepting walking as a viable means of transportation (encouragement)
Community Structure and Physical Activity
Growth of the Movement • Initial focus on transportation • Land use may have more effect • Health and Built Environment • Health Impact Assessments
Role of Public Health in Walkable Communities • Don’t have to be technical experts • Use our current skills • Create Demand - for walking • Normalize Walking • Change social norms around walking
Role of Public Health (Cont) • Create Demand - for walkable environments • educate public and decision makers • develop/nurture pedestrian advisory groups • policies and ordinances • hold events • get media attention • get walkers to public hearings
Walkable Community – The Role of Public Health Long Term Outcomes Intermediate Outcomes Short Term Outcomes Healthy Heart Program Influential Citizens • Walkable Communities Slide • Show • State Pedestrian Conference • Walk to School Week • Presentations • Walkable Communities • Workshops • Communication campaign • Healthy Heart Contractors • Initiative for Healthy Infra. • Parks & Trails NY • Umbrella for pedestrian • groups Increase Walking Walkable Communities (Opportunities) Local Decision Makers Trained Professionals State Policies Normalize Walking (Attitudes) BC Walks
NYS DOH Initiatives to Promote Walkable Communities • 17 local Healthy Heart Program contractors-many work on bike/ped issues • Initiative for Healthy Infrastructure (SUNY Albany), Parks and Trails NY, Transportation Alternatives • 9 new worksite and school contractors • 4 Steps to a Healthier US counties – Chautauqua, Broome, Rockland, Jefferson. • Cardiovascular Health In NYS – A Plan for 2004 – 2010 • Developing a state Obesity Prevention Plan • Walkable Communities Workshops • Walk to School Week/Safe Routes to School • State Pedestrian Conference • BC Walks, America on the Move • NYS Physical Activity Coalition (www.nysphysicalactivity.org)