Download

1 / 27
270 likes | 405 Views
Vehicle Index Estimation for Signalized Intersections Using Sample Travel Times Peng Hao , Zhanbo Sun, Xuegang (Jeff) Ban, Dong Guo , Qiang Ji Rensselaer Polytechnic Institute ISTTT 20, The Netherlands July 19, 2013.

E N D
Vehicle Index Estimation for Signalized Intersections Using Sample Travel Times PengHao, Zhanbo Sun, Xuegang (Jeff) Ban, Dong Guo, QiangJi Rensselaer Polytechnic Institute ISTTT 20, The Netherlands July 19, 2013 Privacy-Preserving IntelliDrive Data for Signalized Intersection Performance Measurement Xuegang (Jeff) Ban Rensselaer Polytechnic Institute (RPI) January 24, 2011 Session 228, TRB-2011
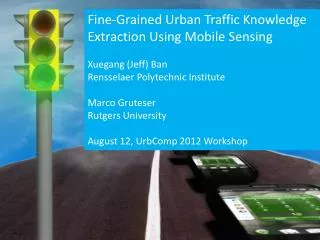
Sample Vehicle Travel Times • Technology advances have enabled and accelerated the deployment of travel time collection systems • Instead of estimating urban travel times from e.g. loop data, sample travel times are directly available
Sample Travel Times for Urban Traffic Modeling • Signalized intersection delay pattern estimation: Ban et al. (2009) • Cycle by Cycle Queue length estimation: Ban et al. (2011); Hao and Ban (2013) • Cycle by cycle signal timing estimation: Hao et al. (2012) • Vehicle trajectory estimation: Sun and Ban (2013) • Corridor travel times: Hofleitner et al. (2012); Hao et al. (2013) • Benefits of using sample travel times • Better to address issues related to the use of new technologies, such as privacy etc. (Hoh et al., 2008, 2011; Herrera et al., 2010; Ban and Gruteser, 2010, 2012; Sun et al., 2013) • More stable than other measures such as speeds (Work et al., 2010) • Challenges: samples only; no direct information of the entire traffic flow
Vehicle Index and Stochasticity of Urban Traffic 3 4 5 6 7 8 1 2 • Stochasticity: Traffic arriving at an intersection is usually stochastic • Stochastic models are often applied to describe intersection traffic: arrival process, departure process, etc. • Question: how to infer sample vehicle indices from their travel times by considering stochastic arrivals and departures? • Vehicle index: the position of a sample vehicle in the departure sequence of a cycle. • It is a bridge between sample vehicles and information about the entire traffic flow
Definition of Queued Vehicles Queued • MTT (minimum traverse time): the measured minimum travel time to traverse the intersection • If the actual travel time exceeds MTT by a pre- defined threshold, the vehicle is considered “queued”
A Bayesian Network Model Arrival Time Index Departure Time Queued vehicles Free flow vehicles The proposed Bayesian Network is a three layer model that integrates the arrival times, the indices, and the departure times of all sample vehicles. The directed arcs indicate conditional dependency of variables.
Arrival Process Arrival Process: Non-homogeneous Poisson process (NHPP) Arrival Time Index Non-homogeneous Poisson process is a Poisson process with a time dependent arrival rate λi. The time difference between Xiand Xi-1follows a gamma distribution with shape parameter Ki-Ki-1and scale parameter 1/λi: Departure Time
Sampling Process Sampling Process: Geometric distribution Arrival Time Index Assuming each vehicle is sampled independently with a given penetration rate p, the index difference of two consecutively sample vehicles Ki-Ki-1follows a geometric distribution: Departure Time
Departure Process The departure time difference, Yi -Yi-1, of the (i-1)th and ith (i≥2) sample queued vehicles follows an index dependent log-normal distribution (Jin, 2009): Arrival Time Index Departure Time Departure Process: First sample vehicle: Index dependent normal distribution Other sample vehicles: Index dependent log-normal distribution (Jin et al., 2009)
Parameter Learning • Departure Process • The departure headway between the hth and jth queued vehicles at an intersection is stable for different cycles. • The location parameter μ and scale parameter σ of a log-normal distribution are estimated from 100% penetration historical data by the maximum likelihood estimation method. • Arrival Process • The arrival rate λ between two sample vehicles are estimated from sample data collected in real time by assuming constant index differences.
Penetration Rate Estimation NGSIM data Field test data Performance of the penetration estimation algorithm • If the penetration rate is unknown, we can estimate it by computing the percentage of the sample queued vehicles (known) in the total queued vehicles (estimated via a simple queue length estimation algorithm).
Vehicle Index Estimation (Inference) The conditional probability of vehicle index, given the observed arrival and departure times, is derived from the graphical representation of the BN model using the chain rule. The index inference results, such as the Most Probable Explanation (MPE) and the marginal posterior distribution can then be calculated based on the conditional probability.
Simplified Bayesian Network Model First four vehicles Other queued vehicles Other free flow vehicles The vehicle departure headway stabilizes at the saturation flow rate after the fourth or fifth headway position after the signal turns green. The basic BN can be decomposed into 3 types of independent sub-networks to reduce computation if the number of sample vehicles is greater than 4.
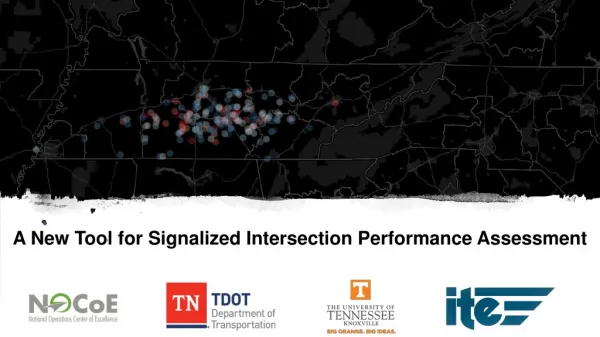
Numerical Experiments (Data) • NGSIM: Peachtree St, Atlanta, Georgia (2 15-minutes; up to 100% penetration) • Field Tests: Albany, NY area (1 hour for each field test; up to 30% using tracking devices and up to 100% for travel times using video cameras)
RPI Tech Park Jordan 105/145/165 Parking Lot (Staging Area) Alexis Dinner Parking Lot Experimental Site
Numerical Experiments (NGSIM Data) Marginal probability of vehicle index
Numerical Experiments (NGSIM) Estimated index (x) and true index (o) Mean Absolute Error vs. Penetration rate
Numerical Experiments (Field Data) Estimated index (x) and true index (o) Mean Absolute Error vs. Penetration rate
Application: BN-Based Queue Length Estimation Sample vehicles • The queue length distribution is the marginal distribution of the last queued vehicle’s index given sample travel times. • The queue length model works with over-saturation and low penetration cases. Arrival Time Index Queue length Hidden vehicles Departure Time K1 K2 K3 K4 Stop line Queue The queue length of a cycle is the index of the last queued vehicle. We focus on the hidden vehicles between the last queued sample vehicle and the first free flow sample vehicle
Numerical Experiments (NGSIM Data) Error vs. Penetration Rate Success Rate vs. Penetration Rate Queue Length Distribution
Summary The Bayesian Network model systematically integrates the major stochastic processes of an arterial signalized intersection, with sample vehicle travel times as the major input (data) to the model. The model is a combination of learning method and domain knowledge The model works better for queued vehicles that for free flow vehicles, and for congested intersections than for less congested intersections. Information on queued vehicles contribute directly to performance (such as queue) estimation, while free flow vehicles contribute to selecting the proper model structure (i.e., distinguish traffic states). The model may provide a useful framework to estimate the performance measures of a signalized intersection using emerging urban traffic data (e.g., sample travel times), such as queue length and intersection delays, as well as the performance measures of arterial corridors or even networks.
References • Ban, X., Gruteser, M., 2012. Towards fine-grained urban traffic knowledge extraction using mobile sensing. In Proceedings of the ACM-SIGKDD International Workshop on Urban Computing, pages 111-117. • Ban, X., Hao, P., and Sun, Z., 2011. Real time queue length estimation for signalized intersections using sampled travel times. Transportation Research Part C, 19, 1133-1156. • Ban, X., and Gruteser, M., 2010. Mobile sensors as traffic probes: addressing transportation modeling and privacy protection in an integrated framework. In Proceedings of the 7th International Conference on Traffic and Transportation Studies, Kunming, China. • Ban, X., Herring, R., Hao, P., and Bayen, A., 2009. Delay pattern estimation for signalized intersections using sampled travel times. Transportation Research Record 2130, 109-119. • Hao, P., Ban, X., Bennett, K., Ji, Q., and Sun, Z., 2011. Signal timing estimation using intersection travel times. IEEE Transactions on Intelligent Transportation Systems 13(2), 792-804. • Herrera, J.C., Work, D.B., Herring, R., Ban, X., and Bayen, A., 2010. Evaluation of traffic data obtained via GPS-enabled mobile phones: the Mobile Century field experiment. Transportation Research Part C18(4) , 568-583. • Hofleitner, A., Herring R., and Bayen, A., 2012. Arterial travel time forecast with streaming data: a hybrid approach of flow modeling and machine learning, Transportation Research Part B, 46, 1097-1122. • Hoh, B., Gruteser, M., Herring, R., Ban, X., Work, D., Herrera, J., and Bayen, A., 2008. Virtual trip lines for distributed privacy-preserving traffic monitoring. In Proceedings of The International Conference on Mobile Systems, Applications, and Services (MobiSys). • Hoh, B., Iwuchukwu, T., Jacobson, Q., Gruteser, M., Bayen, A., Herrera, J.C., Herring, R., Work, D., Annavaram, M., and Ban, X,2011. Enhancing Privacy and Accuracy in Probe Vehicle Based Traffic Monitoring via Virtual Trip Lines. IEEE Transactions on Mobile Computing, 11(5), 849-864. • Jin, X., Zhang, Y., Wang, F., Li, L., Yao, D., Su, Y.,& Wei, Z. (2009). Departure headways at signalized intersections: A log-normal distribution model approach, Transportation Research Part C, 17, 318-327. • Sun, Z., and Ban, X., 2012. Vehicle trajectory reconstruction for signalized intersections using mobile traffic sensors. Submitted to Transportation Research Part C. • Sun, Z., Zan, B., Ban, X., and Gruteser, M., 2013. Privacy protection method for fine-grained urban traffic modeling using mobile sensors. Accepted byTransportation Research Part B. • D. Work, S. Blandin, O. Tossavainen, B. Piccoli, and A. Bayen. A traffic model for velocity data assimilation. Applied Mathematics Research eXpress,2010(1):1-35, 2010.
Thanks! • Questions? • Email: banx@rpi.edu • URL: www.rpi.edu/~banx
Real World Data by Industry Partners • A signalized intersection of a major US city • Very sparse data (2-9 sample vehicles per day) • Sampling frequency: 15 seconds
Results (I) • If there is a queued sample vehicle in a cycle, the position of the vehicle in the queue and the maximum queue length of the cycle can be estimated
Results (II) • Observation: • We need 1 queued sample vehicle in a cycle in order to provide some estimates of the cycle