Download
1 / 18
180 likes | 252 Views
Observation of the RPCs after UXC Set point change from 19 to 17degC. What we can observe. Average Chamber temperatures just before and after 18 Oct 2010. Yoke temperature. Individual examples of chamber temps. Distribution in Z Longer term Conclusions.

E N D
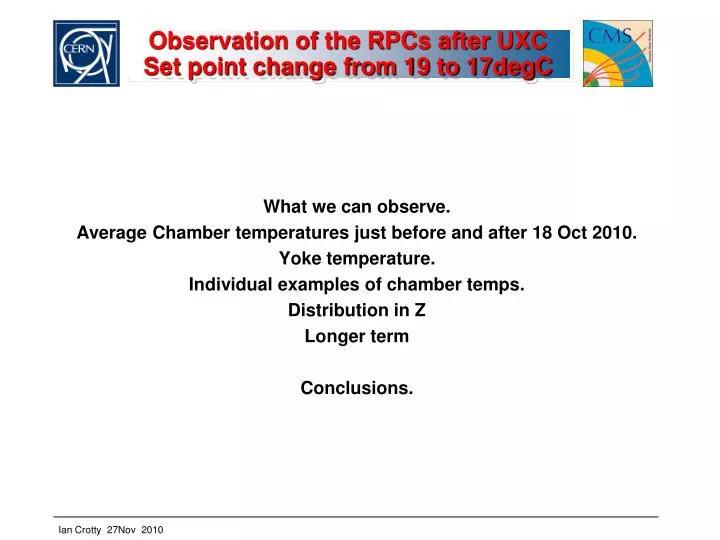
Observation of the RPCs after UXC Set point change from 19 to 17degC What we can observe. Average Chamber temperatures just before and after 18 Oct 2010. Yoke temperature. Individual examples of chamber temps. Distribution in Z Longer term Conclusions.
Ambient temp change did change on the 18 Oct. SPC = Set Point Change 19 -17 degC
0.04degC 0.23degC Average temps after SP Change 0.36degC 0.06degC 0.28degC 0.31degC Set Point 19 -17 18 Oct 2010
Observation of the RPCs after UXC Set point change from 19 to 17degC The SPC caused the temperatures to slightly decrease, which is good. In addition the changes were more pronounced with distance from IP. The very small differences in the RE1s can be explained by the enclosed nature of their installation behind the CSCs. The RE2 and 3s are greater due to the greater exposure in that the CSCs are on the opposite wall (yoke). The difference between the RE2 and 3 may be due to the distance from the IP and associated heat sources. It should be pointed out that absolute values differences are small. The following slides give some individual cases
Unfortunately these logs of temperature do not allow us to improve our understanding of the actions taken and the impact on the RE system Logged Yoke temps are not representative of the real conditions. 1 degC variation in less than a day
Temperature change of RE1/207.This chamber is on the YE+1 18 Oct 2010 SPC
Temperature change of RE3/307.This chamber is on the YE+3 18 Oct 2010 SPC
Temperature change of RE-3/307.This chamber is on the YE-3 18 Oct 2010 SPC
RPC Temp Distributions in June 2010 21.92C 20.83C 20.25C 19.41C 18.67C 20.25C 20.33C 19.90C 19.79C 20.32C 21.33C +Z -Z RB0 0.75C 0.5C 0.8C 0.8C 0.7C 0.6C Gains since April 2010
RPC Temp Distributions on 30 Nov 2010 StDev 21.58C SD=0.36 22.08C SD=0.35 20.80C SD=0.4 20.34C SD=0.28 19.71C SD=1.10 19.00C 20.57C 20.55C 20.12C 20.05C 20.81C SD=0.61 Mean +Z -Z RB0 Increases are mitigated by the work undertaken during the year 0.03C 0.3C 0.49C 0.25C 0.09C 0.16C Small increases since June 2010
Increasing of UXC temp since Aug Part of the reason for the increase on the long term
Temperature plot of UXC for 2010 The structure is similar to the following slide showing chamber temps but without the increase since June June to SPC
RE average temperatures during 2010 Steady temp increases since June until SPC
RB average temperatures during 2010 Temperatures are far more stable
Observation of the RPCs after UXC Set point change from 19 to 17degC
Web Based Monitoring source RPC Temperature Now 2010.11.30 19:20:58 UTC Heartbeat 2010.11.30 19:20:33 UTC The green sections represent those chambers which have sensors. Clearly the RB are better instrumented than the RE.
Conclusions The Set Point Change (SPC) in the UXC reduced by 2 degrees. The ambient temperature at the X3 level in UXC reduced by 0.6-0.8degC. The chamber temperature reduction reached 0.3-0.4 degrees at best in the RE3 regions. There is a persistent asymmetry in the temperatures of the RE3s. Increases since June have been greater in the RE1s. From June to November there has been a steady increase in RE temps that is not evident in RB. As well as remnant heat emanating from the central detector region of CMS as has been suggested perhaps we see well cooled chambers in the barrel region and an influence of the ambient air temperature on the RE2 and RE3s. This implies that any attempt to circulate cool enough ambient air between the yokes will help. We need a solution to keep the present RE stations as cool as the barrel and also the future RE4 that we have started building.