Download
1 / 24
240 likes | 320 Views
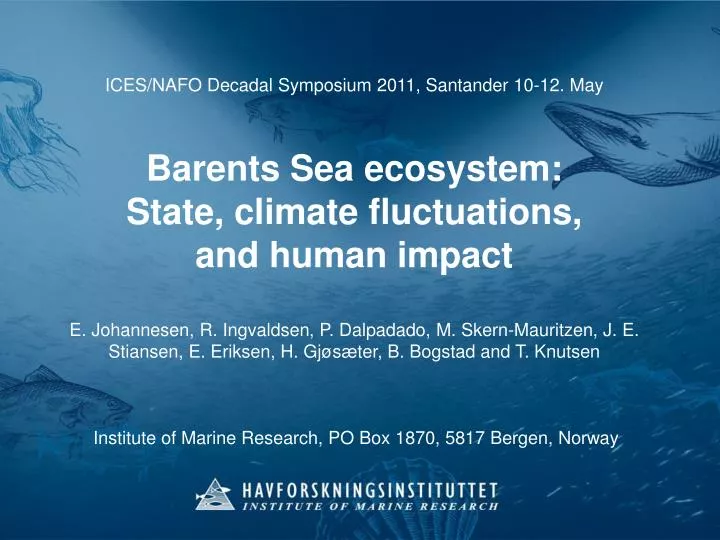
ICES/NAFO Decadal Symposium 2011, Santander 10-12. May Barents Sea ecosystem: State, climate fluctuations,

E N D
ICES/NAFO Decadal Symposium 2011, Santander 10-12. MayBarents Sea ecosystem: State, climate fluctuations, and human impactE. Johannesen, R. Ingvaldsen, P. Dalpadado, M. Skern-Mauritzen, J. E. Stiansen, E. Eriksen, H. Gjøsæter, B. Bogstad and T. KnutsenInstitute of Marine Research, PO Box 1870, 5817 Bergen, Norway
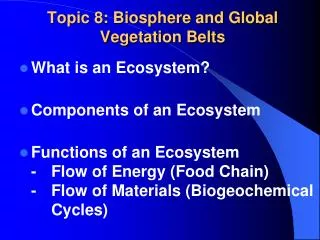
Aim: • To assess the state of the Barents Sea ecosystem 2000-2009 • in comparison with earlier decades • Main biological components • Top predators • Pelagic fish • Zooplankton/benthos • Primary production • Ecological process • External driving forces • fishing • climate And all this in only20 minutes!
The Barents Sea, physical features: • Large • 1.6 mill km2 • High latitude • ~70°-80°N • Shelf sea • Mean depth 230m BarentsSea Russia Norwegian Sea Norway North Sea
The Barents Sea, main species: HADDOCK POLAR COD SHRIMP PHYTOPLANKTON COPEPODS OTHER BENTHOS
External driving forces: Climate: Fishing: Inflow, ice cover, atmospheric conditions => determine the extent and characteristics of main water masses • Arctic water • Mixed/Frontal water Atlantic water • Mainly by Russia and Norway • Demersal fishery • -Mainly cod/haddock • -Shrimp, other demersal fish • Capelin • Harp seals/minke whales
BARENTS SEA 1970-2009 Normalized time series Demersal fish Below average ~Long term average Pelagic fish Above average Shrimp Missing value Zooplankton Climate Fishing
Our data: Fishing Climate HADDOCK POLAR COD SHRIMP PHYTOPLANKTON COPEPODS OTHER BENTHOS
The ecosystem state described with PCA on 20 time series Most important factors PC2 HighCapelinBiomassLow HighShrimpstockLow Most important factors PC1 Low Temperature High Low Haddock Biomass High High Fishing mortality cod Low
Development in main species: • Demersal fish: • 1970’s: High levels • 1980’s: Historic low levels • 1990’s: Variable • 2000’s: Increasing=>cod comparable to 1950’s • Pelagic fish: • 1970’s: Abundant capelin/Polar cod • No herring • 1980’s: 1. capelin collapse and recovery • Return of herring • 1990’s: 2. capelin collapse and recovery • 2000’s: 3. capelin collapse /recovery • Other pelagics abundant • Zooplankton /Shrimp: • Strong variability, • especially in 1980’s and 1990’s • 2000’s: Shrimp/Krill increasing trend
Development in external driving forces: Fishing: 1970’s: High / increasing 1980’s: High on demersal fish High on capelin fishing until collapse 1990’s: Demersals: reductionfollowed by increase 2000-2009: Decreasedoncod => New harvestcontrolrule
Development in external driving forces: Climate: 1970’s-1990’s Increasing trend Strong variability Variation correlated with NAO Variation correlated across water masses 2000-2009: Warmest on record (since 1900) Increase in mixed water Reduction in Arctic water Correlation with NAO breaks (~1997)
Development in interactions: Demersal fish: Pelagic fish Krill Shrimp Correlations betwen trophic levels by decade
Development in interactions: 1970-1979: Demersal fish: 0.6 -0.4 0.1 Pelagic fish 0.6 Krill Shrimp => Mostly positive= bottom up POLAR COD
Development in interactions: 1980-1989: Demersal fish: -0.3 -0.2 -0.6 Pelagic fish 0.3 Shrimp Krill -0.6 Zooplankton biomass Mainly negative: top-down
Development in interactions: 1990-1999: Demersal fish: -0.3 -0.2 -0.0 Pelagic fish -0.9 Shrimp Krill -0.6 Zooplankton biomass Negative: top-down
Development in interactions: 2000-2009: Demersal fish: -0.1 0.5 0.8 Pelagic fish 0.1 Shrimp Krill -0.2 Zooplankton biomass Positive/weak negative: bottom-up
Development in interactions: Effect of prey on predators: Weight age 5 ~ log (capelin biomass y-1) ns ns * *** Seperate regressions by decade and species: => Temperature ns
Summary last decade: • 2000-2009: • Warmestonrecord • Decreasing/lowfishingpressureoncod • Highdemersalstocks=> codstockcomparable to the 1950’s • Capelincollapse and recovery, otherpelagicfish abundant • Krill and shrimpincreased • Trophic forcingchanged from topdown to mostlybottom-up • No cleareffectofcapelincollapseon predators (e.g. haddock/codweight) • Hightemperature = highproduction/biodiveristyof alternative prey? • HighTemperature=> large feeding area 1986 1996 2006 Pelagics abundance Bottom temperatures during the three capelin collapses
Summary: • BarentsSea 1970-present: • 1970’s Highstocks, bottom up regulation • 1980’s : Pertubationscausingstrongvariability and top-downcontrol in the1980-90’s • Returnofherring, collapseofcapelin • Heavy fishingpressure • Cold • 2000-2009: • Bottom up • Weakerinteractions/Lesseffectofcapelinon predators => Returnto the 1970’s? Or something not previouslyobserved? ? ?
Temperature FB Krill /Zooplankton biomass 1970’s na /0.2 1980’s -0.2/-0.5 1970’s -0.7/-0.5 1970’s 0.1/0.4