Download
1 / 32
320 likes | 419 Views
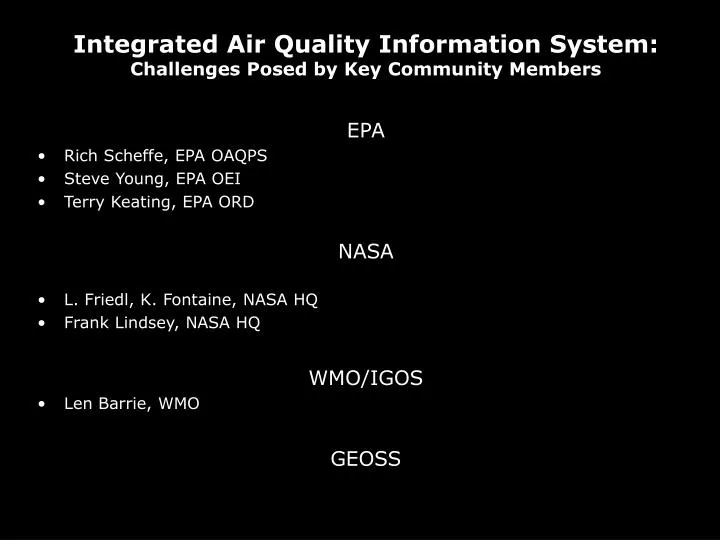
Integrated Air Quality Information System: Challenges Posed by Key Community Members. EPA Rich Scheffe, EPA OAQPS Steve Young, EPA OEI Terry Keating, EPA ORD NASA L. Friedl, K. Fontaine, NASA HQ Frank Lindsey, NASA HQ WMO/IGOS Len Barrie, WMO GEOSS. Scheffe Challenge.

E N D
Integrated Air Quality Information System: Challenges Posed by Key Community Members EPA • Rich Scheffe, EPA OAQPS • Steve Young, EPA OEI • Terry Keating, EPA ORD NASA • L. Friedl, K. Fontaine, NASA HQ • Frank Lindsey, NASA HQ WMO/IGOS • Len Barrie, WMO GEOSS
The Scheffe Challenge: ‘Organizations - Programs – Data Mess’ GEOSS PM research NAS, CAAAC CASAC, OMB NOAA EPA PHASE Eco-informatics NASA CDC Programs Risk/exposure assessments Organizations Private Sector AQ forecasting NPS States/Tribes RPO’s/Interstate NAAQS setting Accountability/ indicators USDA SIPs, nat.rules designations NARSTO DOE Enviros Academia NADP Satellite data IMPROVE, NCore PM monit, PAMS Intensive studies PM centers Data sources Supersites CASTNET Health/mort. records Other networks: SEARCH, IADN.. Lidar systems CMAQ GEOS-CHEM Emissions Meteorology Info System Challenges: What’s the overall dependency Information Flow Forces and Controls on Data Flow Cooperation, Competition, Co-Opetition Information System of Systems
Air Quality Management System: Components and Functions Decision Support System (DSS) Public Value Adding Processes Organizing Quality controlFormattingDocumentingDisplaying Analyzing Interpreting Evaluating Separating Synthesizing Deciding Evaluate optionsMatching goals CompromisingChoosing Human Agents Data Manager, Organizer Technical Analysts,Program Manager Policy Analysts, Decision Maker The primary purpose of data systems is to serve programs/projects Programs perform analysis for Orgs., the DSS is within programs The big decisions of societal importance are Organizations (This needs more wisdom from the practioners)
Relationship BetweenOrganizations - Programs – DataVersion 0.1 Flow of Control Public and special interest groups set up organizations and provides them with funding Organizations develop programs, define their scope, governance and funding Programs satisfy their information needs by monitoring or by using other’s data Data sources acquire the data for their parent programs and also expose them for reuse Data need, $$ Info needs, $$ Goals $$ Public Actionable Knowledge Decision, Action Organized Data Measure, Organize Analyze, Report Judge, Decide, Act Flow of Information Data systems organize the measurements and models and provide them to programs. Programs analyze the data and provide actionable knowledge to organizations. Organizations evaluate multiple information sources, make decisions and act.
Information System Components for AQ Programs Obs. & Models Decision Support System Control Std. Interface Std. Interface Data Reports Datasets Data Views Integrated Data Reports Public Machine Information System Human Information System
Flow of Data and Usage Control Flow of Control Reports are commissioned by programs Analysts select, explore, and process data for a report Obs. & Models Decision Support System Control Std. Interface Std. Interface Data Reports Datasets Data Views Integrated Data Reports Flow of Data Providers expose data to analysts who extract the needed subset The data is pulled into data exploration or processing software
User Agencies Flow of Data and Usage Control Obs. & Models Decision Support System Control Std. Interface Std. Interface Data Reports Datasets Data Views Integrated Data Reports Acquisition processing Control Requesting Information User Programs Sensors Info System Data NAAQS SIPs Forecast GEOSS … Providing Information hhh
The Steve Young Challenges Obs. & Models Decision Support System Control Std. Interface Std. Interface • Real-time monitoring & watch for surprises • Inform decision-makers & assess outcomes • Support for adaptive management Data Reports Datasets Data Views Integrated Data Reports
S. Young Challenge #1:Real-time monitoring & watching for surprises Obs. & Models Decision Support System Control Std. Interface Std. Interface Data Reports Datasets Data Views Integrated Data Reports Choose Data & Tools Browse, Explore Trigger Response
S. Young Challenge #2:Inform decision-makers & assess outcomes Obs. & Models Decision Support System Control Std. Interface Std. Interface • This needs more work • Ideas? How could the info-system help here? Data Reports Datasets Data Views Integrated Data Reports Monitoring (Sensing) AssessmentCompare to GoalsPlan ReductionsTrack Progress AirQuality Close the sensory-motor loop! Controls (Actions)
Flow of Data Flow of Control Informing Public Air Quality Data AQ Compliance Data to Knowledge Transformation Meteorology Data Network Assess. Status and Trends Emissions Data Tracking Progress S. Young Challenge #3.Support for Adoptive AQ ManagementFrom ‘Stovepipe’ to Workflow Software Obs. & Models Decision Support System Control Std. Interface Std. Interface Data Reports Datasets Data Views Integrated Data Reports Loosely Coupled Workflow
The Terry Keating Challenges Obs. & Models Decision Support System Control Std. Interface Std. Interface Data Facilitate data-model comparison, assimilation Reports Data Sharing Gen. Processing Domain Processing Reporting Include global perspective (observation, model, analysis)
GEOSS Architecture Mapped to Air QualityThe L. Friedl, K. Fontaine Challenge Obs. & Models Decision Support System Control Std. Interface Std. Interface Data Reports Datasets Data Views Integrated Data Reports Special Architectural Features: Implied data assimilation into models Decision Support black box Focus on model predictions, not ‘simulation’ Pollutant ‘Characterization’ is implicit Not part of DataFed Policy, Management, Personal Decisions
IGOS Architecture Mapped to DataFedThe Len Barrie Challenge Obs. & Models Decision Support System Control Std. Interface Std. Interface Data Reports Datasets Data Views Integrated Data Reports Special Architectural Features: Real-time data assimilation into AQ models Characterization of global pattern Not part of DataFed Quality assurance, CalVal? Integrated Data Archives? -
Applications Private Shared AQ Policy NOAA NASA EPA Other FedS Air Quality Consortium Data, Tools, Methods Priv Regulation DoI Research F. Lindsey, NASA:Air Quality Collaborative Consortium Goal: Cross-leverage the shared partner resources and activities, while Maintaining partner’s autonomy in capabilities and activities Approach: Exchange the resources at the web ‘interfaces’, like portals. Infuse cutting-edge technologies and resources into Agencies as needed. Use ESIP portal as the linker and the Air Quality cluster as the mediator. Outcome: Sharing and integration could form next-generation capabilities. Savings by re-use and better information by broader perspectives Better air quality through more informed management
Value-Adding Processes Obs. & Models Decision Support System Control Std. Interface Std. Interface Data Reports Datasets Data Views Integrated Data Reports Value-Adding Processes Organizing DocumentStructureFormat Exploring DisplayBrowseCompare Analyzing Filter/IntegrateAggregate/FuseAssimilate Data Manager Technical Analysts DB System Analysis System Reporting System
Loosely Coupled Data Access through Standard ProtocolsOGC Web Coverage Service (WCS) Obs. & Models Decision Support System Control Std. Interface Std. Interface Data Reports Datasets Data Views Integrated Data Reports Server GetCapabilities Client Std. Interface Std. Interface Capabilities, ‘Profile’ Client request Capabilities Server returns Capabilities and data ‘Profile’ Client requests data by ‘where, when, what’ query Server returns data ‘cube’ in requested format Back End Where? When? What? Which Format? Front End GetData Data T1 T2
Service Chaining & Workflow Web Services and Workflow for Loose Coupling Obs. & Models Decision Support System Control Std. Interface Std. Interface Data Reports Datasets Data Views Integrated Data Reports Web Service Interaction Service Broker Find Publish Bind Service User Service Provider
Co Writing - Wiki Screencast Collaborative Reporting and Dynamic Delivery Obs. & Models Decision Support System Control Std. Interface Std. Interface Data Reports Datasets Data Views Integrated Data Reports Analysis Reports: Information supplied by manyNeeds continuous program feedbackReport needs many authorsWiki technologies are for collaborative writing Dynamic Delivery: Much of the content is dynamicAnimated presentations are compellingMovies and screencasts are for dynamic delivery
The Network Effect:Less Cost, More Benefits through Data Reuse Programs ask/get Data Data Orgs Develop Programs Public sets up Orgs Data Program Data Organization Program Data Re-Use Network Effect Public Program Organization Data Data Program Data Pay only once Richer content Less Prog. Cost More Knowledge Less Soc. Cost More Soc. Benefit Data are costly resource– should be reused (recycled) for multiple applications Datareuse saves $$to programs and allowsricher knowledgecreation Data reuse, likerecycling takes some effort: labeling, organizing, distributing
P. Senge et. al, 1994: Fifth Discipline Fieldbook (Link) Guiding Idea:System of Systems Domain of Action Organizational Architecture Infrastructure: Web 2.0, Local Champs Methods, Tools:Standards, Use Cases GEOSS/AMI Domain of ActionsBased on ideas of P. Senge: Architecture of Learning Organizations Possible DataFed Roles: • Guiding Idea: Refine, solidify, evangelize the System of Systems idea • Methods and Tools: Develop, promote, implement standards; Coordinate SoS use cases • Infrastructure: Maintain the DataFed middleware for distributed data access; Supply Agency champions with SoS ‘sales’ material
Flexible NAAMS Key Agencies for Air Quality Management and Science Advanced Monitoring InitiativeProgrammatic Path to GEOSS Advanced Monitoring InitiativeProgrammatic Path to GEOSS
Goal: Advance air quality model-observation complex to level of meteorological FDDA systems • Build Organizational frameworks : IGACO-EMEP efforts • Data base, IT standards: data unification center? Practical LRTAP task? • Standardization/QAQC Reference material, or method (aerosols) • Adopt model evaluation/fusion as a design principle • Support linkage of ground based and satellite observation platforms through development of a sustainable vertical profiling system (aircraft and ground based lidar) • Address integration of disparate data bases • QA/QC: provide requirements for data standards/metadata descriptions • Data base unification • Harness the communities around major tools, platforms and programs. • Air quality modeling platforms (GEOS-chem, MOZART, CMAQ,….more) • Satellite Instruments (MODIS, OMI) • Existing routine surface (AIRNow) and aircraft programs • Integration efforts (AEROCOM)
The Architecture of SoS Networks • SoS Architecture – Form and Function Different aspects of the network Right Level of Networking?
One of the key factors dictating the achievement of system-of-systems configurations that support network centric operations is the availability of mechanisms that promote information sharing among systems. Direct system-to-system linkages presuppose that the systems know a priori about each system that might benefit from any other system. Many combat situations have disproved this assumption. • Emergent behavior in a network that is only created by the combination, not by the individual members. • Emergent behavior: novel and coherent (logically connected, purposeful, meaningful) structures, patterns and properties arising from self-organization (mashers are self-organizers) in complex systems Wikipedia • Emergent behavior is created by mashing • Mashing occurs when open on both ends of network.- diffusion • Input side – grow by assimilation • Output side – Harvest (i.e. DataFed harvests datasets)
Stages of Self-Organization • Stage 1: Expose goods. Sharing was doable, but lots of work. Need glue, duct tape, shop-based approach. Value Shop. • Burden: user pays • Stage 2: Mediated sharing. DataFed, where wrappers/adapters used. Loose coupling automate the wrapper and mediator • Burden: Mediator pays. Users gain. • Stage 3: Creating new things together, service chaining, mashing, collaboration – Emergent behavior where network produces value, non-linearly. • Burden: creators • Tim Burners-Lee: The web allows creating new things together. • Howard Rheingold: The computer as mind amplifiers. • The ultimate goal of all this is to both amplify the mind of individuals and also connect the minds.