Download
1 / 18
180 likes | 301 Views
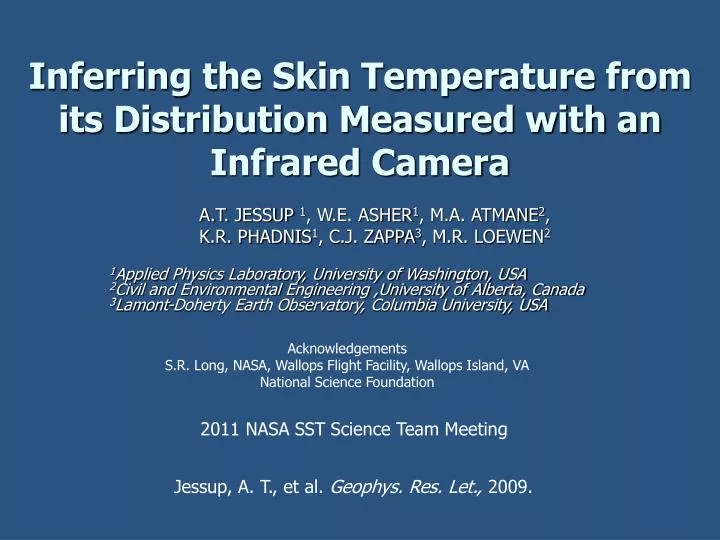
Inferring the Skin Temperature from its Distribution Measured with an Infrared Camera. A.T. JESSUP 1 , W.E. ASHER 1 , M.A. ATMANE 2 , K.R. PHADNIS 1 , C.J. ZAPPA 3 , M.R. LOEWEN 2

E N D
Inferring the Skin Temperature from its Distribution Measured with an Infrared Camera A.T. JESSUP 1, W.E. ASHER1, M.A. ATMANE2, K.R. PHADNIS1, C.J. ZAPPA3, M.R. LOEWEN2 1Applied Physics Laboratory, University of Washington, USA2Civil and Environmental Engineering ,University of Alberta, Canada3Lamont-Doherty Earth Observatory, Columbia University, USA Acknowledgements S.R. Long, NASA, Wallops Flight Facility, Wallops Island, VA National Science Foundation 2011 NASA SST Science Team Meeting Jessup, A. T., et al. Geophys. Res. Let., 2009.
Boundary Layer Thickness Skin Temperature Thermal Signature of Boundary Layer Disruption Random Eddy Penetration • Not all eddies fully disrupt BL • BL thickness varies • Skin temperature varies • Seek to determine: • Does complete disruption of TBL occur? • If so, how often? • Implications • Surface Renewal Theory • Can DT be inferred from distribution? Zappa et al [1998] (adapted from Harriott [1962] and Gulliver [1991])
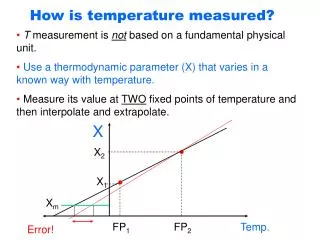
Temperature Profile Cool Skin Effect at an Air-Water Interface Heat loss due to evaporation Causes surface to cool AIR WATER SURFACE d 1 mm THERMAL BOUNDARY LAYER Tbulk IR Optical Depth is 10 mm, so IR measures Tskin Tskin DT 0.1 to 0.5 C Bulk-skin temperature difference Tbulk also referred to as Tsubskin
Wire Wake Disruptions: FLIP 1992 • Measured DT • IR radiometer • Thermistor at 0.1 m • Compared with DTwakes = Tin wake – Toutside wake • Results – • Low wind • DT = 0.55 K • DTwakes = 0.45 K • High wind • DT = 0.2 K • DTwakes = 0.1 K • Within measurement uncertainty • Complications • Accuracy of IR: no external calibration • Tbulk measurement depth • Skin temperature recovery Zappa et al [1998]
Wire Mesh Surface Disrupter: FLIP: COPE 1995 & FAIRS 2000 Schiff [2006] Branch [2006]
DT from Tsurf Distribution PDF for Tsurf Surface Renewal with constant Q Tskin combined with lognormal PDF for t Tbulk [Soloviev and Schlϋssel., 2004] Then fit to PDF is given by [Garbe et al., 2004] • Tskin = mean of PDF • Tbulk = intercept of T-axis [Garbe et al., 2004]
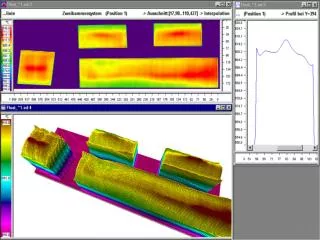
Tprofile Flux Exchange Dynamics Study (FEDS) 4NASA Air-Sea Interaction Research Facility, Wallops Island, Virginia InstrumentationMeasurement IR Camera kH via ACFT, p(Tsurf) IR Radiometer Tskin, calibrated “LabRad”: Accuracy ± 0.05 K Air: U, T, q profiles Qnet, u* SeaBird T sensors Tbulk, calibrated: Accuracy 0.001 K Fast T sensor Twater, sub-skin profiles Gas Chromatograph Bulk kG LabRad IR radiometer Tskin (calibrated) IR camera kH via ACFT Tbulk via PDF CO2 laser FLUXES Qsensible Qlatent u* Tair qair u Wind 45 cm Tbulk 28 mm 72 mm 150 mm 76 cm
Experimental Conditions • Winds Speed: 4.1 to 9.3 m s-1 • Friction Velocity: 0.09 to 0.55 m s-1 • Heat Flux (up): 20 to 442 W m-2 • Air-water DT: -6 to 3.9 K • Relative Humidity: 70 to 81 % • Bulk-skin DT: 0.10 to 0.24 K Data Set: 22 runs of 5-min duration
Sub-skin Temperature Profile Profile, Bulk, and Skin Temperature Correction to Tb vs Tb-Ts Tb - Tp(zmin) < 0.04 K Well mixed Tb: T from sensor at 28 mm Tp(z): Profile T Ts: Skin T from LabRad
Surface Temperature PDF • Long tails typical • Ts from LabRad • Assign to mean • Tb from profile • Mean Percentile 99.90 • 99.80 or above for 19 of 22 runs Occurrence of Tb in PDF implies complete surface renewal Can DT be inferred from distribution?
R/V Kilo Moana 6-16 Dec Samoa to Hawaii IR Camera LTAIRS – Lighter-than-Air Remote Sensing M-AERI Mk II • Compare IR PDF with Tskin and Tbulk • Investigate Spatial Variability SSP Surface Salinity Profiler ISAR
Conclusion • Laboratory investigation of surface disruption • Tskin measured using calibrated IR radiometer • Tbulk measured & occurred at 99.90 %-ile in p(Tsurf) • Demonstrated that: • Complete renewal occurs • Partial renewal is a common occurrence • Tbulk given by Tmax in PDF from IR image • Estimate of Saunders’ l consistent with others
Implication of High Percentile of Tb in PDF Very rapid cooling if all renewals complete OR Partial renewal also occurs • Compare DT to cooling expected in mean t • Comparable: Most events complete • Significantly less: partial renewal common
Surface Renewal Time Scale from Active Controlled Flux Technique Measurement k: thermal diffusivity
DT Recovery in time t Soloviev and Schlüssel [1994] Q: net heat flux r: density of water cp: specific heat Change in time t: DTt= 0.06 ± 0.03K Measured bulk-skin difference: DT= 0.16 ± 0.04 K On average, a water parcel renewing the surface does not have enough time to cool down to mean Ts
Degree of Partial Renewal • Consider t* • Time for complete • renewal based on DT • Compare to t • Ratio t/ t • >>1 for low Q • approaches 1 for large Q Behaves like surface renewal only when strongly forced
Saunders’ Constant l Conduction Eq. Measured: l= 5.9 ± 1.9 Dimensional Analysis Saunders predicted l=6
Compare to Ward and Donelan [2006] • Measured dc • Found l=2.4 ± 0.5 via but So l=6.3