Download
1 / 30
330 likes | 774 Views
Anaerobic Metabolism. Main pathway in Vertebrates = Glycolysis (catabolism of carbohydrates) ATP production by glycolysis begins rapidly after initiation of activity or exposure to hypoxia/anoxia.

E N D
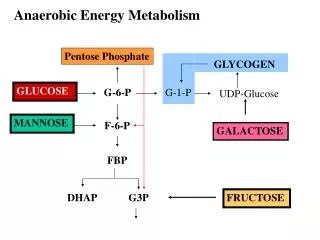
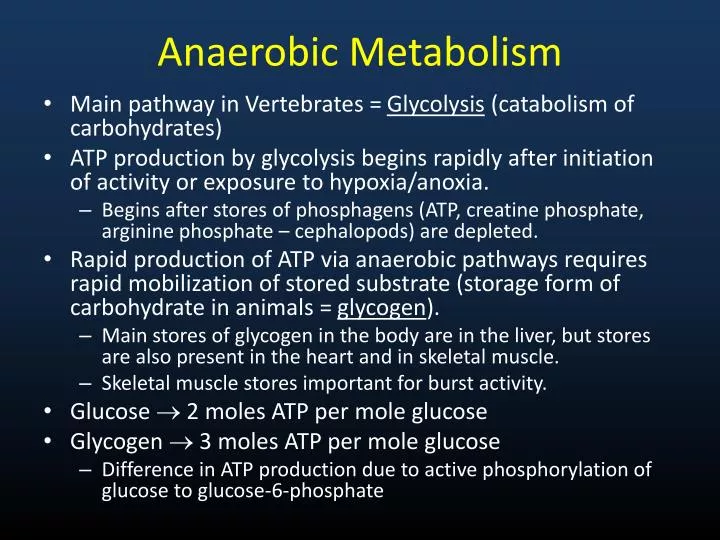
Anaerobic Metabolism • Main pathway in Vertebrates = Glycolysis (catabolism of carbohydrates) • ATP production by glycolysis begins rapidly after initiation of activity or exposure to hypoxia/anoxia. • Begins after stores of phosphagens (ATP, creatine phosphate, arginine phosphate – cephalopods) are depleted. • Rapid production of ATP via anaerobic pathways requires rapid mobilization of stored substrate (storage form of carbohydrate in animals = glycogen). • Main stores of glycogen in the body are in the liver, but stores are also present in the heart and in skeletal muscle. • Skeletal muscle stores important for burst activity. • Glucose 2 moles ATP per mole glucose • Glycogen 3 moles ATP per mole glucose • Difference in ATP production due to active phosphorylation of glucose to glucose-6-phosphate
- 1 ATP - 1 ATP Fig 6.6 – Glycolysis pathways and key side pathways * denote key regulatory sites
Anaerobic Metabolism • Rate at which glycolysis proceeds is determined by activities (or concentration) of component enzymes, especially regulatory or rate-limiting enzymes = catalyze the slowest step in a multi-step pathway so limit the rate at which the entire process may proceed. • Glycolysis Regulatory Enzymes: • Phosphofructokinase (PFK) = major regulatory enzyme for glycolysis • Inhibitors = ATP, citrate, fatty acids • Activators = ADP, AMP, fructose-2,6-P2 • Pyruvate Kinase (PK) • Inhibitors = ATP, citrate, alanine • Activators = PEP, fructose-1,6- P2 • Glycogenolysis – limited by glycogen phosphorylase, which is activated by phosphorylation • Allosteric modifiers: Activators = AMP, glucose; Inhibitors = ATP, glucose-6-P • Terminal Stage in glycolysis in vertebrates (and some invertebrates, but to a lesser degree) is catalyzed by lactate dehydrogenase. • Pyruvate Lactate (G favors lactate)
Fig 6.6 – Glycolysis pathways and key side pathways * denote key regulatory sites
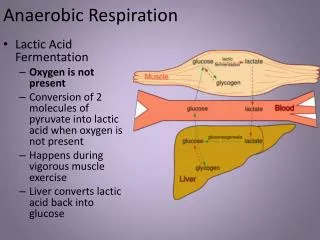
Anaerobic Metabolism • Alternative Routes to lactate exist at two points in glycolytic pathway • Alternative at terminal branch point • In many invertebrates, lactate dehydrogenase is “replaced” by functionally analogous imino acid dehydrogenases, so that imino acids accumulate as glycolytic end products. • Basically serves to combine pyruvate + amino acid • No change in ATP yield • These alternative are used by invertebrates under conditions of hypoxia or anoxia (e.g., tidal molluscs) • These alternative routes also generate NAD+ from NADH, so allow sustained anaerobic metabolism, although with low power.
Amino Acid Imino Acid Example Reaction: beta-alanine + pyruvate + NADH + H+ beta-alanopine + NAD+ + H2O Β - alanopine
Fig 6.6 – Glycolysis pathways and key side pathways * denote key regulatory sites
Anaerobic Metabolism • Adaptation at PEP branch point • Glycolysis normally proceeds PEP Pyruvate Lactate (or some alternative) • Alternate route = PEP Oxaloacetate Propionate • Catalyzed by Phosphoenolpyruvatecarboxykinase(PEPCK) • This route characterized by low activities of PK and LDH, high levels of PEPCK • Also regenerates NAD+ and provides up to 6 moles ATP per mole glucose. • Allows sustained anaerobiosis, but again with low power. • Present in Molluscs, Roundworms (Nematodes), Parasitic flatworms (Platyhelminthes)
Fig 6.6 – Glycolysis pathways and key side pathways * denote key regulatory sites Alternatives at PEP branch point PEPCK Alternatives at terminal branch point
Anaerobic Metabolism • Fermentation of Aspartate (an amino acid) • Pathway = Aspartate + -ketoglutarate glutamate + oxaloacetate • Oxaloacetate Propionate (same pathway as alternate PEP route) • Also a sustainable anerobic pathway. • To sustain, requires that -ketoglutarate is regenerated. • This is accomplished by … Glutamate + pyruvate alanine + -ketoglutarate (alanine accumulates as an end product) • Used by molluscs (particularly intertidal bivalves)
Fig 6.6 – Glycolysis pathways and key side pathways * denote key regulatory sites alanine α-ketoglutarate glutamate pyruvate
Anaerobic Metabolism • Evolutionary trend is toward higher levels of activity in advanced invertebrates. This trend continues throughout vertebrate evolution. • Associated with this trend is a tendency for lesser reliance on sustained anaerobic pathways and greater used of arginine phosphate (cephalopods), creatine phosphate, and lactate, with their high power output, which is necessary to fuel intense activity.
Aerobic Metabolism • Pathways are available to use carbohydrates, fats, and proteins. • All substrates eventually feed into the Krebs Cycle (occurs in mitochondrial matrix), which feeds electrons (in the form of NADH or FADH2 = reducing equivalents) into the electron transport system of the inner mitochondrial membrane. • The ETS generates ATP.
Krebs Cycle • Krebs Cycle completely oxidizes carbon molecules in substrates to CO2. • For example, 6-C glucose completely oxidized to 6 molecules of CO2. • In contrast, anaerobic glycolysis catabolizes 6-C glucose to two 3-C lactate molecules. • This increased oxidation markedly amplifies the yield of ATP (38 ATP per glucose vs. 2 for anaerobic glycolysis) • End Products of aerobic metabolism: • Carbos and fats = CO2 and water • Proteins/amino acids = CO2 + water + HCO3- + NH4+ • CO2 removed at lungs or gills; Ammonia incorporated into nitrogenous waste products and excreted
Krebs Cycle • Regulation = as for glycolysis, rates are dependent on concentrations of component enzymes, particularly rate-limiting enzymes • Pyruvate Dehydrogenase Complex (3 enzymes + 5 coenzymes) = Catalyzes: • Pyruvate Acetyl-CoA + CO2 (inhibited by ATP, acetyl-COA; activated by Ca2+) • Citrate Synthase = major regulatory enzyme of Krebs Cycle. Catalyzes: • Oxaloacetate + acetyl-CoA citrate (rate largely determined by availability of substrates). • Primary inhibitor = succinyl-CoA, also inhibited by ATP, NADH, and long-chain fatty acyl CoA esters.
Fig 6.8a – The Krebs Cycle showing reducing equivalents generated, ATP generated and CO2 produced
Pyruvate dehydrogenase complex Fig 6.8b – The Krebs Cycle showing key control points
Entry of Substrates into Krebs Cycle • Carbohydrates = Glycolysis Pyruvate Acetyl CoA to Krebs (pyruvate to acetyl-CoA is catalyzed by Pyruvate Dehydrogenase complex) • Lipids– stored lipids (triacylglycerol) mobilized by hormonally controlled triacylglycerol lipases • Yields 3 long-chain fatty acids + glycerol. • Glycerol is catabolized via glycolysis. • Fatty acids broken down 2-C per cycle in -oxidation pathway and then enter Krebs Cycle via acetyl-CoA.
Entry of Substrates into Krebs Cycle • Also, peroxisomes may break down long-chain fatty acids to short- or medium-chain fatty acids, which are more readily metabolized. • -oxidation occurs in mitochondrial matrix. FFA must first be transferred into mitochondrial matrix and activated by formation of fatty acyl-CoA. • Acyl-CoA Synthetase in OMM and ER catalyzes : • fatty acid + coenzyme A → fatty acyl-CoA (uses ATP) • To get across mitochondrial membranes, carnitine serves as a carrier (reaction catalyzed by fatty acyl-CoA carnitine transferase) • fatty-acyl coA + carnitine → fatty acyl carnitine + coA • Once in mitochondrial matrix, reconverted to fatty acyl-CoA by acyl-CoA synthetase. • fatty acyl carnitine → fatty acyl CoA + carnitine (uses GTP)
β-Oxidation • Rate limiting step in -oxidation is apparently -hydroxyacyl CoA dehydrogenase (at least in muscle), so increased -HOAD activities allow increased flux of FFA as fuel. • NADH acts as an inhibitor • Another potentially rate-limiting step is the transfer of FFA to the mitochondrial matrix (includes Fatty Acid Binding Protein– intracellular transport, acyl carnitine transferase). • Also, movement of fat across cell membrane by fatty acid translocase and FABPpm may limit fat catabolism capacity.
Fig 6.12 – The Β-oxidation pathway
Fig 6.11 – Transfer of fatty acids across mito. membranes
Intracellular lipid transfer: FABPC Fuel stores Fuel sources Fuel mobilization & plasma transport Trans-membrane transfer PM = FA Translocase, FABP pm MM = Carnitine acyl trasferase Fuel delivery Fuel consumption Cellular aerobic capacity From Taylor et al. 1996
Entry of Substrates into Krebs Cycle • Proteins/Amino Acids = entry into Krebs Cycle involves two steps: • Removal of amino group – eventually excreted as nitrogenous waste • Conversion of carbon skeletons to pyruvate, acetyl-CoA, or other Krebs Cycle intermediates • Step 1 above is rate-limiting. • Efficiency of catabolism is lower than for carbohydrates and fats because nitrogenous waste removal incurs a cost. • ATP yields are approximately similar to those for carbohydrates.
Fig 6.13 – Entry of amino acids into the Krebs cycle Note that different amino acids enter as different Krebs cycle intermediates.
Oxidative Phosphorylation (ETS of IMM) • NADH or FADH2 from Krebs Cycle are fed through ETS with molecular oxygen serving as the final electron acceptor. • ½ O2 reacts with 2 protons to form water (“metabolic water”). • As electrons proceed down ETS, protons are released into the intermembrane space between IMM and OMM • This builds up proton and electric (charges differ on the two sides of the membrane) gradients across the IMM. • The energy stored in these gradients is then used to drive ATP synthesis. • As protons move down the gradient through a channel in the F0-F1 ATPase in IMM, energy is released that is coupled to the synthesis of ATP from ADP + Pi. • NAD+ and FAD+ are regenerated by the ETS.
Fig 6.9 – Electron carriers and ATPase of ETS
Reciprocal Regulation: Carbs and Lipids • Prolonged muscular activity (e.g., endurance exercise) results in the preferential use of fat relative to carbohydrates. • PFK inhibited by citrate and fatty acids, so cycling though the Krebs Cycle and -oxidation inhibits glycolysis increased reliance on fats as fuel. • Pyruvate Dehydrogenase is inhibited by acetyl-CoA. This also inhibits carbohydrate catabolism with prolonged muscular activity. • Since glycolysis is inhibited, Glucose-6-phosphate levels increase and G-6-P inhibits glycogen phosphorylase and hexokinase, thereby sparing muscle glycogen and blood glucose. Depletion of muscle glycogen is correlated with fatigue in mammals.
Reciprocal Regulation: Carbs and Lipids • Gluconeogenesis in liver from amino acids and pyruvate is promoted by -oxidation acetyl-CoA, which stimulates pyruvate carboxykinase, which catalyzes: • This keeps blood glucose supply essentially constant during prolonged exercise and this is important since glucose is required for proper functioning of the brain (can’t use fat as fuel). Pyruvate carboxylase PEP carboxykinase Pyruvate Oxaloacetate PEP Glucose