Download
1 / 25
260 likes | 444 Views
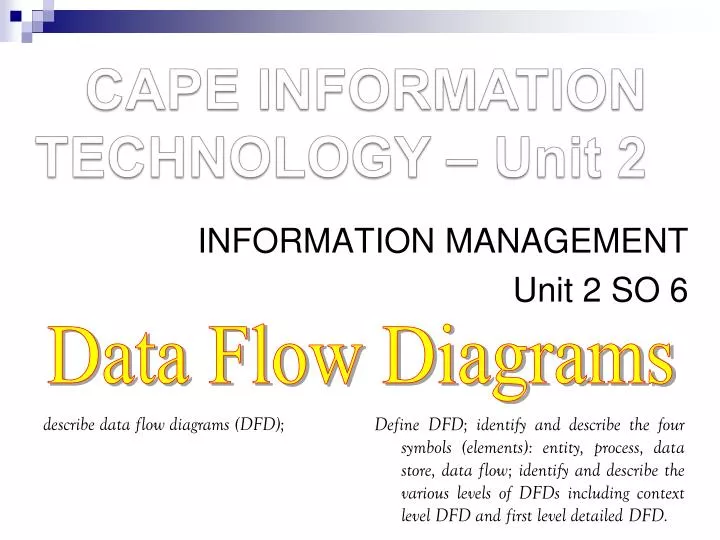
CAPE INFORMATION TECHNOLOGY – Unit 2. INFORMATION MANAGEMENT Unit 2 SO 6. Data Flow Diagrams. What are Data Flow Diagrams (DFDs)?.

E N D
CAPE INFORMATION TECHNOLOGY – Unit 2 INFORMATION MANAGEMENT Unit 2 SO 6 Data Flow Diagrams
What are Data Flow Diagrams (DFDs)? • A Data Flow Diagram (DFD) is a graphical representation of the "flow" of data through an Information System. It differs from the as it shows the flow of data through processes instead of hardware. • A Data Flow Diagram can also be used for the visualization of data processing (structured design). • Data flow diagrams were invented by Larry Constantine, the original developer of structured design, based on Martin and Estrin's "data flow graph" model of computation
Data Flow Diagrams (DFDs) Data flow diagram (DFD) is a picture of the movement of data between external entities and the processes and data stores within a system
DFD Symbols (Gane & Sarson) Process DataFlow DataStore Source/Sink (External Entity)
Process Work or actions performed on data (inside the system) Labels should be verb phrases Receives input data and produces output
Rule 1: Process Can have more than one outgoing data flow or more than one incoming data flow
Rule 2: Process Can connect to any other symbol (including another process symbol)
Data Flow Is a path for data to move from one part of the Information System to another Arrows depicting movement of data Can represent flow between process and data store by two separate arrows
Data Store Is used in a DFD to represent data that the system stores Labels should be noun phrases
Rule: Data Store Must have at least one incoming and one outgoing data flow
Source/Sink (External Entity) External entity that is origin or destination of data (outside the system) Is the singular form of a department, outside organisation, other IS, or person Labels should be noun phrases Source – Entity that supplies data to the system Sink – Entity that receives data from the system
Rule: Source/Sink Must be connected to a process by a data flow
Rules for Using DFD Symbols Data Flow That Connects YES NO
Context Diagram Top-level view of IS Shows the system boundaries, external entities that interact with the system, and major information flows between entities and the system. Example: Order system that a company uses to enter orders and apply payments against a customer’s balance
Level-0 DFD Shows the system’s major processes, data flows, and data stores at a high level of abstraction When the Context Diagram is expanded into DFD level-0, all the connections that flow into and out of process 0 needs to be retained.
Lower-Level Diagrams Functional Decomposition An iterative process of breaking a system description down into finer and finer detail Uses a series of increasingly detailed DFDs to describe an IS Balancing The conservation of inputs and outputs to a data flow process when that process is decomposed to a lower level Ensures that the input and output data flows of the parent DFD are maintained on the child DFD
Strategies for Developing DFDs Top-down strategy Create the high-level diagrams (Context Diagram), then low-level diagrams (Level-0 diagram), and so on Bottom-up strategy Create the low-level diagrams, then higher-level diagrams