Download
1 / 41
410 likes | 582 Views
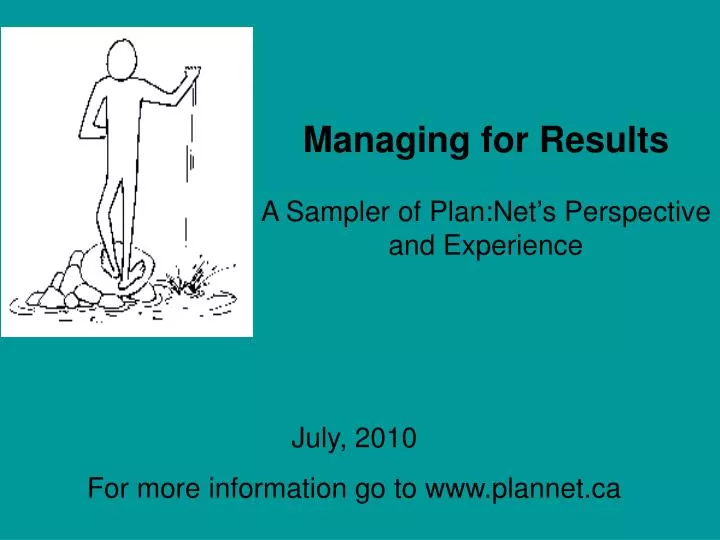
Managing for Results A Sampler of Plan:Net’s Perspective and Experience. July, 2010 For more information go to www.plannet.ca. Commitments to Results Accountability. Results Based Management (RBM) evolves as a means of regulating the flow of public funds under New Public Management.

E N D
Managing for ResultsA Sampler of Plan:Net’s Perspective and Experience July, 2010 For more information go to www.plannet.ca
Commitments to Results Accountability • Results Based Management (RBM) evolves as a means of regulating the flow of public funds under New Public Management. • By the mid 90’s, All OECD countries have adopted results based management approaches as a matter of policy. • Canadian Federal and Provincial Ministries, multilateral organizations and philanthropic organizations looking for evidence of results achieved.
What does this mean in practical terms? • When making a plan, or reporting on progress, we are challenged like never before to: • Describe the connection between the work we doand the difference we make
Example…If you are developing… • Applied Research on Eco Tourism… You would focus attention on… • the number of men and women participants; • what they are exposed to through their interactions; • what they contribute of their own knowledge and experience; • experiments started, finished, documented and shared and also… • What participants DO with the knowledge, confidence, contacts gained • eco-tourism business plans, financing and start ups • employment and revenue • protection of ecosystem • behaviour and attitude shifts within target market
Three RBM Tools Results Logic Model/Framework Risk Analysis and Management Table Monitoring and Evaluation Plan
Important Preparatory Steps Before beginning a results based plan.. 1. Looking Inward - Mandate • Competencies • Experience 2. Looking Outward • Issues & Opportunities 3. Clarifying Priorities and Planning Perspective/Scale
Situation Assessment - Stakeholders Influence HIGH High Interest/ Importance, High Influence High Interest/ Importance, Low Influence Interest or Importance Consider ways to strengthen or protect interests Build coalition of support Low Interest/ Importance, High Influence Low Interest/ Importance, Low Influence LOW Spend more time on the other Stakeholders Caution - be aware of risks or obstacles HIGH LOW
Understanding your Working Environment - Stacey Matrix Far from Agreement Anarchy Political Aspects Complicated Complex Simple Close to Agreement Complicated Far from Certainty Close to Certainty Technical Aspects
Where is your project or organization on the Stacey Matrix? • Implications for planning and management?
Splash and Ripple! Splashand Ripple ! - a metaphor for RBM
A Progression of Results - Typical Terms Ultimate Outcomes Conditions - Social Economic Civic Cultural Environmental Intermediate Outcomes Performance Improved - Institutional behaviour changes End-user benefits Larger scale policy and programming shifts Social mobilization Immediate Outcomes Capacities Developed - Institutional exchanges/collaborations Applied knowledge Functioning spaces/infrastructure System improvements/adaptations New/Improved leadership Aligned decision-making Outputs What we Produce - Networks Courses Trained participants Assessments Publications Infrastructure Activities What we Do - Research Build Train/Mentor Promote Procure Convene Inputs What we Need - Staff Equipment Supplies Office Space Services
Ultimate Outcomes Activities Outputs Outputs Outputs Outputs Outputs Activities Activities Activities Activities Intermediate Outcomes Intermediate Outcomes Intermediate Outcomes Immediate Outcomes Immediate Outcomes Immediate Outcomes Immediate Outcomes Inputs Logic Model Format Why What we want How
Enablers and Constraints… • Are forces affecting any part of your programme or project, both positively and negatively. • Examples of Enablers or Constraints (project/programme level) • Dominant attitudes or behaviours among stakeholders (positive or negative) • Related government policies or programmes (positive or negative) • International agreements or conventions (positive or negative) • Uncertain or cyclical weather conditions
Effect Significant (3) Monitor Risks Risk Mitigation Required Risk Mitigation Required Moderate (2) Risk Mitigation Required Monitor Risks Acceptable Risks Minor (1) Monitor Risks Acceptable Risks Acceptable Risks Low (1) Medium (2) High (3) Likelihood Risk Analysis Matrix A Hypothetical Project to Support Entrepreneurs Intermediate Outcome: Member participants manage viable, employment-generating enterprises 1. What could hamper progress? 2. What is the likelihood of a problem? 3. What impact would the problem have on the intermediate outcome?
A Typical Risk Assessment and Management Table Caution…this is a summary tool - use creative methods to generate the content for this table.
What indicators tell us about the wind… Who has seen the wind? Neither you nor I. But where the trees bow down their heads, The wind is passing by. -The Wind, Christina Rosetti, 1830-1894
Monitoring and Evaluation - The Distinction • Monitoring A continuous (or regular) self-assessment of progress -collecting data and comparing current performance with planned activities and results. • Evaluation Independent (often external), periodic, strategically focused assessment of a programme/project’s continuing relevance, management, governance, results, coverage, external relationships, sustainability, etc.
Indicators… • Evidence that the programme is producing expected results at the output and outcome levels. • They can be expressed quantitatively and qualitatively. • Information collected should help managers make wise decisions.
Quantitative Indicators Expressed as a percentage, ratio, proportion, comparison, or number that can be analyzed statistically Examples? • Proportion of members (f,m) who say they have improved their business skills since joining the Entrepreneurship Programme • Number of new jobs created and lost by programme members in the past year • Composition of programme (f,m) membership, by area of business activity • Value of goods sold in the past year • Percentage of members showing: • Market expansion • Increased product range • Improved sales • ….In the past year
Qualitative Indicators Expressed as a change or comparison between at least two states of understanding or experience that can be analyzed for patterns Relies on people’s judgment or perception Examples? • Perceptions of men and women participants of the way in which the Entrepreneurship Programme is guiding members through the current global economic crisis • Trends in the level and type of coverage of Entrepreneurship Program by local business writers and reporters • Trends in the calibre of business plan submissions, with reference to: a) innovation, b) strength of case, c) clarity of presentation
A Typical Performance Measurement Framework Caution…this is a summary tool - use creative methods to generate the content for this table.
From Activities to Results • In RBM, we are challenged to describe what has changed NOT what was done
When Reporting on Results… • Place the people affected, or the product generated by the activity in the centre of your statements, not the person doing the activity • If you think you are describing an activity, ask the “so what” question
When Reporting on Results… Be guided by your results framework • Outputs • Immediate Outcomes • Intermediate Outcomes • Ultimate Outcomes More specifically, look to your indicators
Planning, Monitoring and Evaluation, Reporting Key functions of Project Cycle Management…
Implementation Project Initiation Proposal Development Donor Appraisal Start Up Monitoring / Evaluation Phase Out The basis for workplans and job descriptions A management reference during team meetings A guide for monitoring and reporting on progress & adjusting strategies An aid in designing an evaluation The centrepiece of your proposal or plan 1. The basis for an introductory conversation with stakeholders RBM tools - Logic Model, Evaluation Framework (PMF) and the Risk Management Plan are relevant to all parts of the programme cycle…