Download
1 / 133
1.33k likes | 1.45k Views
The Current Renaissance of Adolescent Treatment. Michael Dennis, Ph.D. Chestnut Health Systems, Bloomington, IL Presentation at “Illinois Adolescent Addiction Training Institute”, July 16 - July 20

E N D
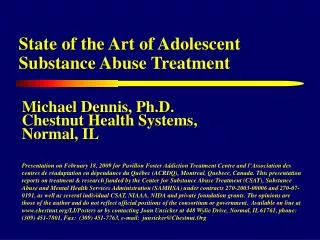
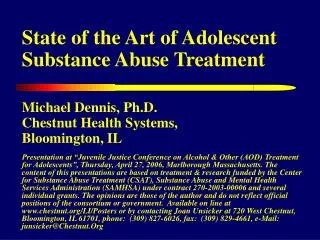
The Current Renaissance of Adolescent Treatment Michael Dennis, Ph.D. Chestnut Health Systems, Bloomington, IL Presentation at “Illinois Adolescent Addiction Training Institute”, July 16 - July 20 2007, Illinois State University, Bloomington Illinois. The content of this presentations are based on treatment & research funded by the Center for Substance Abuse Treatment (CSAT), Substance Abuse and Mental Health Services Administration (SAMHSA) under contract 270-2003-00006 and several individual grants. The opinions are those of the author and do not reflect official positions of the consortium or government. Available on line at www.chestnut.org/LI/Posters or by contacting Joan Unsicker at 720 West Chestnut, Bloomington, IL 61701, phone: (309) 827-6026, fax: (309) 829-4661, e-Mail: junsicker@Chestnut.Org
Goals of this Presentation • Epidemiological Course: To examine the prevalence, course, and consequences of adolescent substance use and co-occurring disorders and the unmet need for treatment • The Treatment System: To summarize major trends in the adolescent treatment system and the variability by state • Evidence Based Practice: To highlight what it takes to move the field towards evidenced-based practice related to assessment, treatment, program evaluation and planning • Treatment Effectiveness: To present the findings from several recent treatment outcome studies on substance abuse treatment research, trauma and violence/crime.
Part 1 Epidemiological Course:To examine the prevalence, course, and consequences of adolescent substance use and co-occurring disorders and the unmet need for treatment
Severity of Past Year Substance Use/Disorders(2002 U.S. Household Population age 12+= 235,143,246) Dependence 5% Abuse 4% No Alcohol or Regular AOD Drug Use 32% Use 8% Any Infrequent Drug Use 4% Light Alcohol Use Only 47% Source: 2002 NSDUH
Adolescent Onset Remission Problems Vary by Age NSDUH Age Groups Increasing rate of non-users 100 Severity Category 90 No Alcohol or Drug Use 80 70 Light Alcohol Use Only 60 Any Infrequent Drug Use 50 40 Regular AOD Use 30 Abuse 20 10 Dependence 0 65+ 12-13 14-15 16-17 18-20 21-29 30-34 35-49 50-64 Source: 2002 NSDUH and Dennis et al forthcoming
Mean (95% CI) $3,058 This includes people who are in recovery, elderly, or do not use because of health problems Higher Costs $1,613 $1,528 $1,309 $1,078 $948 Higher Severity is Associated with Higher Annual Cost to Society Per Person $4,000 Median (50th percentile) $3,500 $3,000 $2,500 $2,000 $1,500 $1,000 $725 $406 $500 $231 $231 $0 $0 $0 No Alcohol or Light Alcohol Regular AOD Any Dependence Abuse Infrequent Drug Use Use Only Drug Use Use Source: 2002 NSDUH
Age of First Use Predicts Dependence an Average of 22 years Later 100 Under Age 15 90 Aged 15-17 80 Aged 18 or older 71 70 63 62 60 51 48 % with 1+ Past Year Symptoms 50 45 41 39 37 40 34 30 30 23 20 10 0 Alcohol: Marijuana: Other Drugs: Tobacco: Pop.=151,442,082 Pop.=176,188,916 Pop.=71,704,012 Pop.=38,997,916 Tobacco, OR=1.3*, Alcohol, OR=1.9*, Marijuana, OR=1.5*, Other, OR=1.5*, Pop.=151,442,082 Pop.=176,188,916 Pop.=71,704,012 Pop.=38,997,916 OR=1.49* OR=2.74* OR=2.45* OR=2.65* Source: Dennis, Babor, Roebuck & Donaldson (2002) and 1998 NHSDA * p<.05
Substance Use Careers Last for Decades 1.0 Median of 27 years from first use to 1+ years abstinence .9 Cumulative Survival .8 .7 Years from first use to 1+ years abstinence .6 .5 .4 .3 .2 .1 0.0 0 5 10 15 20 25 30 Source: Dennis et al., 2005
Substance Use Careers are Longer the Younger the Age of First Use Age of 1st Use Groups 1.0 .9 .8 Cumulative Survival .7 Years from first use to 1+ years abstinence .6 .5 under 15* .4 15-20* .3 .2 21+ .1 0.0 * p<.05 (different from 21+) 0 5 10 15 20 25 30 Source: Dennis et al., 2005
Substance Use Careers are Shorter the Sooner People Get to Treatment Year to 1st Tx Groups 1.0 .9 .8 Cumulative Survival .7 Years from first use to 1+ years abstinence 20+ .6 .5 .4 .3 10-19* .2 .1 0.0 0-9* * p<.05 (different from 20+) 0 5 10 15 20 25 30 Source: Dennis et al., 2005
Treatment Careers Last for Years 1.0 .9 Cumulative Survival .8 Median of 3 to 4 episodes of treatment over 9 years .7 Years from first Tx to 1+ years abstinence .6 .5 .4 .3 .2 .1 0.0 0 5 10 15 20 25 Source: Dennis et al., 2005
Adolescent Initiation Rising Adult Initiation Relatively Stable The Growing Incidence of Adolescent Marijuana Use: 1965-2002 Source: OAS (2004). Results from the 2003 National Survey on Drug Use and Health: National Findings. Rockville, MD: SAMHSA. http://oas.samhsa.gov/nhsda/2k3nsduh/2k3ResultsW.pdf
Importance of Perceived Risk Risk & Availability Marijuana Use Source: Office of Applied Studies. (2000). 1998 NHSDA
Actual Marijuana Risk • From 1980 to 1997 the potency of marijuana in federal drug seizures increased three fold. • The combination of alcohol and marijuana has become very common and appears to be synergistic and leads to much higher rates of problems than would be expected from either alone. • Combined marijuana and alcohol users are 4 to 47 times more likely than non-users to have a wide range of dependence, behavioral, school, health and legal problems. • Marijuana and alcohol are the leading substances mentioned in arrests, emergency room admissions, autopsies, and treatment admissions.
Substance Use in the Community Source: Dennis and McGeary (1999) and 1997 NHSDA
Consequences of Substance Use Source: Dennis, Godley and Titus (1999) and 1997 NHSDA
Need for Treatment (% of 24,753,586 Adolescents in the U.S. Household Population) 10% 15% 20% 25% 0% 5% 14.9% Tobacco 17.8% Alcohol 10.7% Alcohol Binge --------Past Month Use------ 11.5% Any Drug Use 8.1% Marijuana Use Any Non-Marijuana Drug Use 5.7% Past Year AOD Dependence or Abuse 8.9% Less than 1 in 10 getting treatment Any Treatment (From NHSDA) 0.7% 88% of adolescents are treated in the public system Public Treatment (From TEDS) 0.6% Source: NSDUH and TEDS (see state level estimates in appendix)
Adolescent AOD Dependence/Abuse Up 27% from 7% in 1995 Prevalence 6.0 to 8.4% 8.5 to 9.0% 9.1 to 9.9% 10.0 to 14.6% U.S.Avg.=8.9% IL=8.1% Source: Wright, D., & Sathe, N. (2005). State Estimates of Substance Use from the 2002–2003 National Surveys on Drug Use and Health (DHHS Publication No. SMA 05-3989, NSDUH Series H-26). Rockville, MD: Substance Abuse and Mental Health Services Administration, Office of Applied Studies (retrieved from http://oas.samhsa.gov/2k3State/2k3SAE.pdf ) and Kilpatrick et al, 2000.
Unmet Treatment Need Adolescent (% of AOD Dependence/Abuse without any private/public treatment) 9 in 10 Untreated Prevalence 82.4 to 90.1% 90.2 to 92.3% 92.4 to 94.2% 94.3 to 98.0% U.S.Avg.=92.2% IL=92.5% Source: Wright, D., & Sathe, N. (2005). State Estimates of Substance Use from the 2002–2003 National Surveys on Drug Use and Health (DHHS Publication No. SMA 05-3989, NSDUH Series H-26). Rockville, MD: Substance Abuse and Mental Health Services Administration, Office of Applied Studies (retrieved from http://oas.samhsa.gov/2k3State/2k3SAE.pdf )
Summary Points on Epidemiological Course • Consequences go up as severity increases from use to multiple substance use, abuse, and dependence. • Substance use disorders typically on-set during adolescence and last for decades. • The earlier the age of onset, the longer the course of substance use • The earlier treatment is received, the shorter the course of substance use • Marijuana has become the leading substance problem • Less than 1 in 10 adolescents with substance abuse or dependence problems receive treatment • Over 88% are treated in the public system
Part 2 The Treatment System:To summarize major trends in the adolescent treatment system and the variability by state
64% increase from 95,271 in 1993 to 158,723 in 2005 Adolescent Treatment Admissions have increased by 61% over the past decade Source: Office of Applied Studies 1992- 2002 Treatment Episode Data Set (TEDS) http://www.samhsa.gov/oas/dasis.htm
Change in Public Sector Admissions (%=(2003-1993)/1993) IL Adol Admissions down slightly Both Cause & Consequence Change Not available -96 to -7% -8 to +33% +34 to +116% +117 to +337% U.S.Avg.=+61% IL=+65% Source: Wright, D., & Sathe, N. (2005). State Estimates of Substance Use from the 2002–2003 National Surveys on Drug Use and Health (DHHS Publication No. SMA 05-3989, NSDUH Series H-26). Rockville, MD: Substance Abuse and Mental Health Services Administration, Office of Applied Studies (retrieved from http://oas.samhsa.gov/2k3State/2k3SAE.pdf )
Methamphetamines & Opiates Rare but Growing Fast 310% 111% 253% 19% 138% 44% 61% growth 36% 46% -56% -66% Marijuana and Alcohol Most Common Change Most other drugs admissions grew slower than expected Change in Focal Substances*: 1993 to 2003 150,000 400% 125,000 300% 100,000 200% 75,000 100% 50,000 0% 25,000 -100% 0 -200% Other\e Alcohol 1993 Inhalants Stimulants Hallucinogens Other Cocaine/Crack Amphetamines Heroin/Opiates Marijuana/Hash 2003 Methamphetamines *TEDS Primary, Secondary or Tertiary problem Source: Treatment Episode Data Set (TEDS) 1993-2003.
Higher on Marijuana and other stimulants Presenting Substances: IL vs. US Similar on Alcohol 100% 90% IL U.S. 80% Lower on other substances 70% 60% 50% 40% 30% 20% 10% 0% Other\e Alcohol Stimulants Inhalants Hallucinogens Cocaine/Crack Amphetamines Other Heroin/Opiates Marijuana/Hash Methamphetamines Source: Primary, Secondary or Tertiary, from Treatment Episode Data Set (TEDS) 1993-2003.
114% 115% Other sources of Referral have grown, but less than expected 61% growth 41% 37% 37% 5% 12% Change in Referral Sources: 1993-2003 90,000 140% JJ referrals have doubled, are 53% of 2003 admissions and driving growth 80,000 120% 70,000 100% 60,000 80% 50,000 40,000 60% 30,000 40% 20,000 20% 10,000 - 0% 1993 School Other Self/Family Community 2003 Agency Care Other SA Tx Other Health Employee/EAP Juvenile Justice Change Source: Treatment Episode Data Set (TEDS) 1993-2003.
Referral Sources: IL vs. US Higher on Juvenile Justice Referrals Lower on Agency to Agency Referrals Source: Treatment Episode Data Set (TEDS) 1993-2003.
82% of Adolescents are treated in Outpatient Settings 208% 66% 56% 61% growth 30% 19% Change Change in Level of Care IOP has had the fastest growth 150,000 400% 125,000 300% Residential has grown, but slower than expected 100,000 200% 75,000 100% 50,000 0% 25,000 -100% 0 -200% Outpatient Intensive Detox Short-term Long-term 1993 Outpatient Residential Residential 2003 Source: Treatment Episode Data Set (TEDS) 1993-2003.
Higher on Outpatient and LTR Lower on IOP, Detox and STR Level of Care: IL vs. US Source: Treatment Episode Data Set (TEDS) 1993-2003.
Baseline Severity Goes up with Level of Care Detox: Higher on Use, but lower on prior tx Detox: Higher on Use Severity Goes up with Level of Care STR: Higher on Dependence 100% 90% 80% 70% 60% 50% 40% 30% 20% 10% 0% Weekly use First used Prior Treatment Case Mix Index (Avg) Dependence at intake under age 15 Outpatient Intensive Outpatient Detoxification Long-term Residential Short-term Residential Source: Treatment Episode Data Set (TEDS) 1993-2003.
These numbers are artificially low because of how they are measured Other Characteristics 0% 10% 20% 30% 40% 50% 60% 70% 80% 90% Male 70% Caucasian 58% System dominated by male, white, 15 to 17 year olds African American 19% Hispanic 17% Other 6% 15 to 17 years old 83% 9 to 11 yrs education 63% Student 57% Employed 16% Psychological Problems 22% Pregnant at Admission 2% Homeless/Runaway 1% Source: Treatment Episode Data Set (TEDS) 1993-2003.
Most Lack of Standardized Assessment for… • Substance use disorders (e.g., abuse, dependence, withdrawal), readiness for change, relapse potential and recovery environment • Common mental health disorders (e.g., conduct, attention deficit-hyperactivity, depression, anxiety, trauma, self-mutilation and suicidality) • Crime and violence (e.g., inter-personal violence, drug related crime, property crime, violent crime) • HIV risk behaviors (needle use, sexual risk, victimization) • Child maltreatment (physical, sexual, emotional)
Median Length of Stay is only 50 days Median Length of Stay Total 50 days (61,153 discharges) Less than 25% stay the 90 days or longer time recommended by NIDA Researchers LTR 49 days (5,476 discharges) STR 21 days (5,152 discharges) Level of Care Detox 3 days (3,185 discharges) IOP 46 days (10,292 discharges) Outpatient 59 days (37,048 discharges) 0 30 60 90 Source: Data received through August 4, 2004 from 23 States (CA, CO, GA, HI, IA, IL, KS, MA, MD, ME, MI, MN, MO, MT, NE, NJ, OH, OK, RI, SC, TX, UT, WY) as reported in Office of Applied Studies (OAS; 2005). Treatment Episode Data Set (TEDS): 2002. Discharges from Substance Abuse Treatment Services, DASIS Series: S-25, DHHS Publication No. (SMA) 04-3967, Rockville, MD: Substance Abuse and Mental Health Services Administration. Retrieved from http://wwwdasis.samhsa.gov/teds02/2002_teds_rpt_d.pdf .
Despite being widely recommended, only 10% step down after intensive treatment 53% Have Unfavorable Discharges Source: Data received through August 4, 2004 from 23 States (CA, CO, GA, HI, IA, IL, KS, MA, MD, ME, MI, MN, MO, MT, NE, NJ, OH, OK, RI, SC, TX, UT, WY) as reported in Office of Applied Studies (OAS; 2005). Treatment Episode Data Set (TEDS): 2002. Discharges from Substance Abuse Treatment Services, DASIS Series: S-25, DHHS Publication No. (SMA) 04-3967, Rockville, MD: Substance Abuse and Mental Health Services Administration. Retrieved from http://wwwdasis.samhsa.gov/teds02/2002_teds_rpt_d.pdf .
Summary of Problems in the Treatment System • The public systems is changing size, referral source, and focus – often in different directions by state • Major problems are not reliably assessed (if at all) • Less than 50% stay 50 days (~7 weeks) • Less the 25% stay the 3 months recommended by NIDA researchers • Less than half have positive discharges • After intensive treatment, less than 10% step down to outpatient care • While JJ involvement is common, little is known about the rate of initiation after detention
Part 3 Evidence Based Practice: To highlight what it takes to move the field towards evidenced-based practice related to assessment, treatment, program evaluation and planning
Context • The field is increasingly facing demands from payers, policymakers, and the public at large for “evidence-based practices (EBP)” which can reliably produce practical and cost-effective interventions, therapies and medications that will • reduce risks for initiating drug use among those not yet using, • reduce substance use and its negative consequences among those who are abusing or dependent, and • reduce the likelihood of relapse for those who are recovering NIDA Blue Ribbon Panel on Health Services Research (see www.nida.nih.gov )
General Behavioral Health Practice • Accumulating evidence indicates that most of the theories and approaches that are used within the community of practitioners are unsupported by empirical evidence of effects • Various lists of 70 or so “proven” empirically supported therapies (ESTs) have proven to be relatively infeasible because they have rarely been compared with each other and generally have not been tested with the clinically diverse samples found in community based settings • Need for a new method of integrating scientific evidence and the realities of practice is called for. Source: Beutler, 2000
Problems and Barriers in SA Tx • People with multiple substance use and multiple co-occurring problems are the norm of severity in practice, but are often excluded from research • Individualization of treatment content/duration is the norm in practice, but research based protocols typically involves fixed components/length that are not as appropriate for heterogeneous problems • No treatment is not considered a ethical or significant option, practitioner’s are more interested in identifying which of several treatments to use for a given type of patient – but few such studies have been done • When research practices have been identified, they are often not adopted because practitioner’s often lack the appropriate materials, training and resources to know when or how to implement them
Randomized Clinical Trials (RCT) are to Evidence Based Practice (EBP) like Self-reports are to Diagnosis • They are only as good as the questions asked (and then only if done in a reliable/valid way) • They are an efficient and logical place to start • But they can be limited or biased and need to be combined with other information • Just because the person does not know something (or the RCT has not be done), does not mean it is not so • Synthesizing them with other information usually makes them better
So what does it mean to move the field towards Evidence Based Practice (EBP)? • Introducing reliable and valid assessment that can be used • At the individual level to immediately guide clinical judgments about diagnosis/severity, placement, treatment planning, and the response to treatment • At the program level to drive program evaluation, needs assessment, and long term program planning • Introducing explicit intervention protocols that are • Targeted at specific problems/subgroups and outcomes • Having explicit quality assurance procedures to cause adherence at the individual level and implementation at the program level • Having the ability to evaluate performance and outcomes • For the same program over time, • Relative to other interventions
Reoccurring Themes in the Examples… • Severity and specificity of problem subgroup • Manualized and replicable assessment and treatment protocols • Relative strength of intervention for a specific problem • Adherence and implementation of intervention • Evaluation of outcomes targeted by the intervention (a.k.a., logic modeling)
The Current Renaissance of Adolescent Treatment Research * Published and publicly available
Full ( ) or Partial ( ) use of the Global Appraisal of Individual Needs (GAIN) Adolescent Treatment Research Currently Being Published • 1994-2000 NIDA’s Drug Abuse Treatment Outcome Study of Adol. (DATOS-A) • 1995-1997 Drug Abuse Treatment Outcome Study (DOMS) • 1997-2000 CSAT’s Cannabis Youth Treatment (CYT) experiments • 1998-2003 NIAAA/CSAT’s 15 individual research grants • 1998-2003 CSAT’s 10 Adolescent Treatment Models (ATM) • 2000-2003 CSAT’s Persistent Effects of Treatment Study (PETS-A) • 2002-2007 CSAT’s 12 Strengthening Communities for Youth (SCY) • 2002-2007 RWJF’s 10 Reclaiming Futures (RF) diversion projects • 2002-2007 CSAT’s 12+ Targeted Capacity Expansion TCE/HIV • 2003-2009 NIDA’s 14 individual research grants and CTN studies • 2003-2006 CSAT’s 17 Adolescent Residential Treatment (ART) • 2003-2008 NIDA’s Criminal Justice Drug Abuse Treatment Study (CJ-DATS) • 2003-2007 CSAT’s 38 Effective Adolescent Treatment (EAT) • 2004-2007 NIAAA/CSAT’s study of diffusion of innovation • 2004-2009 CSAT 22 Young Offender Re-entry Programs (YORP) • 2005-2008 CSAT 20 Juvenile Drug Court (JDC) • 2005-2008 CSAT 16 State Adolescent Coordinator (SAC) grants • 2006-2010 CSAT 33 Adolescent Assertive Family Treatment
NH WA ME MT VT ND MN OR MA ID WI NY SD WY MI RI PA IA CT NE OH NJ NV IN UT IL CA CO WV DE VA KS MO KY MD NC TN OK AZ NM AR SC 0 GA 1 to 10 AL MS 11 to 25 26 to 100 TX LA AK FL HI VI PR One or more state or county wide systems uses the GAIN GAIN Clinical Collaborators Adolescent and Adult Treatment Program DC 7/07
CSAT Adolescent Treatment (AT)Outcome Data Set Recruitment: 1998-2006 (updated annually) Sample: The 2006 CSAT adolescent treatment data set included data with 1 to 4 follow-ups on 12,690 adolescents from 96 local evaluations Levels of Care: Early Intervention, Outpatient, Intensive Outpatient, Short, Moderate & Long term Residential, Corrections Based and Post Residential Outpatient Continuing Care Instrument: Global Appraisal of Individual Needs (GAIN)(see www.chestnut.org/li/gain) Follow-up: Over 80% follow-up 3, 6, 9 & 12 months post intake Funding: CSAT contract 270-2003-00006 and 72 individual grants
Current CSAT AT Outcome Data Set by Grant Program DC: Drug Court (2005-2009; 524 from 6 grants) CYT: Cannabis Youth Treatment (1997-2001; 600 from 4 grants) YORP: Young Offender Re-entry Project (2004-2008; 524 from 14 grants) ATM: Adolescent Treatment Model (1998-2002; 1,429 from10 grants) SCY: Strengthening Communities-Youth (2002-2007; 2,292 from 11 grants) EAT: Effective Adolescent Treatment (2003-2007; 5,255 from 27 grants) TCE: Other Targeted Capacity Expansion (2002-2009; 523 from 8 grant) ART: Adolescent Residential Treatment (2003-2006; 1,899 from16 grants) Source: CSAT 2006 AT Outcome Data Set (n=12,601)
Level of Care (n=12,601) Source: CSAT 2006 AT Outcome Data Set (n=12,601)
Type of Treatment (n=12,601) * Data Prior to current AAFT program replicating A-CRA Source: CSAT 2006 AT Outcome Data Set (n=12,601)
Demographics Source: CSAT 2006 AT Outcome Data Set (n=12,601)