Download
1 / 12
120 likes | 267 Views
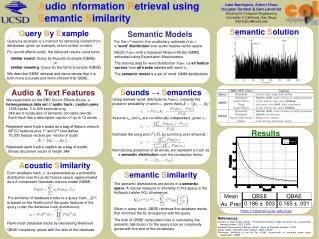
www.kdd.uncc.edu. CCI, UNC-Charlotte. Net Promoter Score and Semantic S imilarity of Clients . p resented by Zbigniew W. Ras. Net Promoter Score (NPS) T racking the number of promoters and detractors to produce the measure of organization's performance.

E N D
www.kdd.uncc.edu CCI, UNC-Charlotte Net Promoter Score and Semantic Similarity of Clients presented by Zbigniew W. Ras
Net Promoter Score (NPS) Tracking the number of promoters and detractors to produce the measure of organization's performance. Companies that achieve long-term profitable growth have NPS two times higher than average company. NPS leaders on the average grow minimum twice the rate of competitors. NPS of companies with the most efficient growth engines [Amazon, Harley-Davidson, Costco, Vanguard, Dell,..] is 50-80 percent. Still there is room for improvement.
Confusion Matrix Promoters = 646+1200.8+2115.2 = 3962; Passive = 2700; Detractor = 2172; Total = 8834 NPS = 3962/8834 – 2172/8834 = 0.448 – 0.250 = 0.198 [~ 20%]
Applying Action Rules to change NPS Let’s assume that we built action rules from the classifiers for Promoter & Detractor. The goal is to change Detractors -> Promoters The confidence of action rule – 0.993 * 0.849 = 0.84 Our action rule can target only 4.2 (out of 10.2) detractors. So, we can expect 4.2*0.84 = 3.52 detractors moving to the promoter status
Current NPS = 0.80 After applying action rule: Promoters = 168.5 + 3.52 = 172.2; Passives = 19.1; Detractors = 10.2 – 3.52= 6.68; Total = 197.8 New NPS = [172.2/197.8 – 6.7/197.8] = 0.87 – 0.03 = 0.84 [ 4 percent improvement is expected]
Clustering Clients – two options 1) Based on a closest distance between vectors (set of features) describing clients. Example of such vector – [location, features extracted from client website, number of customers,…………] 2) Propose a new measure called semantic similarity of clients Assume that C1, C2 are classifiers (rules) extracted from the Datasets of Client 1 and Client 2, respectively. Classifiers for Client 2 Classifiers for Client 1 Dataset-1 for Client 1 Dataset-2 for Client 2 Check the similarity between Client 1 and Client 2 by testing Dataset-1 and Dataset-2 on classifiers for Client 1 and Client 2
Dataset 1 [Client 1] Dataset 2 [Client 2] M1 - Classifier Promoter M2 - Classifier Passive M3 - Classifier Detractor N2 - Classifier Passive N1 - Classifier Promoter N3 - Classifier Detractor x1 test on M2 get confidence c11 x2 test on M1 get confidence c12 x3 test on M3 get confidence c13 y1 test on N1 get confidence c21 y2 test on N1 get confidence c22 y3 test on N3 get confidence c23 y1 test on M1 get confidence c31 y2 test on M1 get confidence c32 y3 test on M3 get confidence c33 x1 test on N2 get confidence c41 x2 test on N1 get confidence c42 x3 test on N3 get confidence c43 Distance(Client 1, Client 2) = [|(c11+c12+c13)-(c31+c32+c33)|+ |(c21+c22+c23)-(c41+c42+c43)|]/3
Lower level of clusters, semantic-based closeness of clients in the same cluster is stronger. 34 clients represented by integers 1, 2, 3…,34
Semantic distance-based dendrogram Recommender System Engine based on Semantic Distance alone. NPS(n1) has to be improved If NPS(n2) > NPS(n1), then Table3 = Table1 Table 2 is assigned to n3. Classifier from Table3 is extracted and its F-score is computed. If F-score3 > F-score1, then Table3 Classifier3 F-score3 We are here NPS(n1) Table1 Classifier1 F-score1 NPS(n2) Table2 Classifier2 F-score2
Semantic distance-based dendrogram Recommender System Engine based on Semantic Distance alone. NPS(n1) has to be improved If NPS(n2) > NPS(n1), then Table3 := Table1 Table 2 is assigned to n3. Classifier from Table3 is extracted and its F-score is computed. If F-score3 > F-score1, then If NPS(n7) > NPS(n1), then Table5 := Table3 Table7 is assigned to n5. Classifier from Table5 is extracted and its F-score computed. If F-score5 > F-score3, then Table3 Classifier3 F-score3 We are here NPS(n1) Table1 Classifier1 F-score1 NPS(n2) Table2 Classifier2 F-score2
Semantic distance-based dendrogram Recommender System Engine based on Semantic Distance alone. NPS(n1) has to be improved If NPS(n2) > NPS(n1), then Table3 := Table1 Table 2 is assigned to n3. Classifier from Table3 is extracted and its F-score is computed. If F-score3 > F-score1, then If NPS(n7) > NPS(n1), then Table5 := Table3 Table7 is assigned to n5. Classifier from Table5 is extracted and its F-score computed. If F-score5 > F-score3, then If we fail moving to n6, then Action Rules or Action Reducts are extracted from Table5 We are here Table3 Classifier3 F-score3 NPS(n1) Table1 Classifier1 F-score1 NPS(n2) Table2 Classifier2 F-score2