Download
1 / 20
200 likes | 265 Views
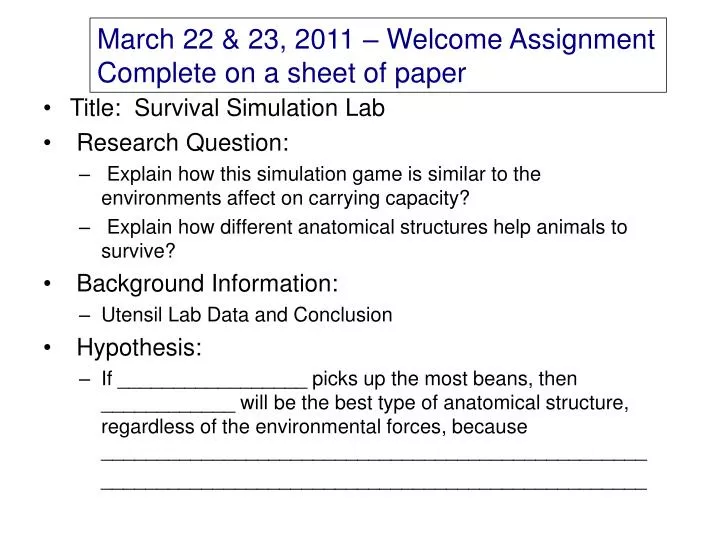
March 22 & 23, 2011 – Welcome Assignment Complete on a sheet of paper. Title: Survival Simulation Lab Research Question: Explain how this simulation game is similar to the environments affect on carrying capacity? Explain how different anatomical structures help animals to survive?

E N D
March 22 & 23, 2011 – Welcome Assignment Complete on a sheet of paper • Title: Survival Simulation Lab • Research Question: • Explain how this simulation game is similar to the environments affect on carrying capacity? • Explain how different anatomical structures help animals to survive? • Background Information: • Utensil Lab Data and Conclusion • Hypothesis: • If _________________ picks up the most beans, then ____________ will be the best type of anatomical structure, regardless of the environmental forces, because _________________________________________________ _________________________________________________
Data Chart. Later you will need to complete the data analysis and conclusion. Data Chart: (we will be doing about 5-7 trials)
1 2 3 4 • Materials: • Chopsticks (5) {eats 2 black or small lima} • Forks (5) {eats 5 big lima or small lima} • Spoons(2) {eats 7 brown or small lima} • Various bean types (big lima, small lima, brown, black) • Timer and 9 cards • Environmental Impact Cards • Procedure: • Select 12 students to act as 3 animal species and 4 students as bean bankers • Spread out Beans on the floor • Begin trial 1 • Give students 10 seconds to pick up bean quota and as many small lima beans as possible • The most small lima beans can minus a player • Record Data in Data Chart • Beans collected are removed from environment • Roll dice and read the EIC card and abide by new parameters • Teacher will add or subtract number of players based on bean count at end of three trials 5 6 7 8 9
Environmental Impact Card 1 • Autumn is here • Crops grow and are harvested • Food supply is abundant (add 10 beans) • And birth rate is good (add one more player if card appears after trial 1)
Environmental Impact Card 2 • Hurricane • High winds over 60 mph and big rain wipe out black bean supply (take out all black beans) • Therefore “chopstick” creatures are affected (2 chopstick players are taken out) • Small lima bean crops however survive and do well (20 Small Lima beans added) • Replenish 30 big lima and brown beans)
Environmental Impact Card 3 • Oil Spill • Ocean water is contaminated and brown beans are wiped out • Therefore there is not enough food for the “spoon” creatures (1 spoon creature is taken out) • Other bean types are not affected (20 more small lima, big lima, and black beans added)
Environmental Impact Card 4 • Tsunami • The wave crashes in to a big lima bean farm and all big lima beans are wiped out (take out all big lima beans) • Therefore the “fork” creatures are affected (take out one fork creature) • All other beans are replenished (10 black, small lima, and brown beans)
Environmental Impact Card 5 • Tornado • A focused location of “chopstick” creatures are affected (take out 2 chopstick creatures) • Not enough creatures to eat all of the black beans therefore there is an over growth of crop (add 20 black beans)
Environmental Impact Card 6 • Drought • “Spoon” creatures are affected (take out 2 spoon creatures • Not enough Spoons to eat the brown beans therefore over growth of crop occurs (add 20 brown beans)
Environmental Impact Card 7 • Earthquake • Harms “fork” population (take out 2 fork players) • Therefore not enough forks to eat big lima beans, over abundance of big lima bean crops (add 20 big lima beans)
Environmental Impact Card 8 • Spring brings birth • Add 3 chopsticks • Add 2 forks • Add 1 spoon
Environmental Impact Card 9 • Global warming • In some areas crops do well and in others they suffer take out 20 small lima beans • All species are affected (take out 1 of each)
Data Chart EIC
Data AnalysisTake the time to write all questions down and answer in complete sentences. For this lab we are focusing on your writing skills and your grade depends on how well you construct your response • What are the patterns and trends in your data chart? • Make a graph that depicts the changing population over time – Don't forget purpose, title of graph, labels, units, key, neatness and accuracy. • Explain your graph in words
Conclusion QuestionsTake the time to write all questions down and answer in complete sentences. For this lab we are focusing on your writing skills and your grade depends on how well you construct your response • 1. Explain how this simulation game is similar to the environments affect on carrying capacity? • 2. Explain how different anatomical structures help animals to survive? • 3. What did you learn from this activity? • 4. How could we improve the lab process?
Data Chart Pd.3 EIC
Data Chart Pd.4 EIC
Data Chart Pd.5 EIC
Data Chart Pd.6 EIC