Download
1 / 32
320 likes | 478 Views
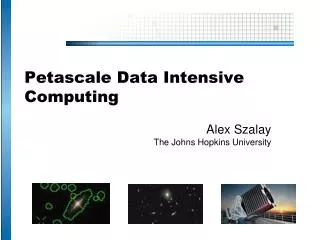
Data-Intensive Scientific Computing in Astronomy. Alex Szalay The Johns Hopkins University. Scientific Data Analysis Today . Scientific data is doubling every year, reaching PBs Data is everywhere, never will be at a single location Need randomized, incremental algorithms

E N D
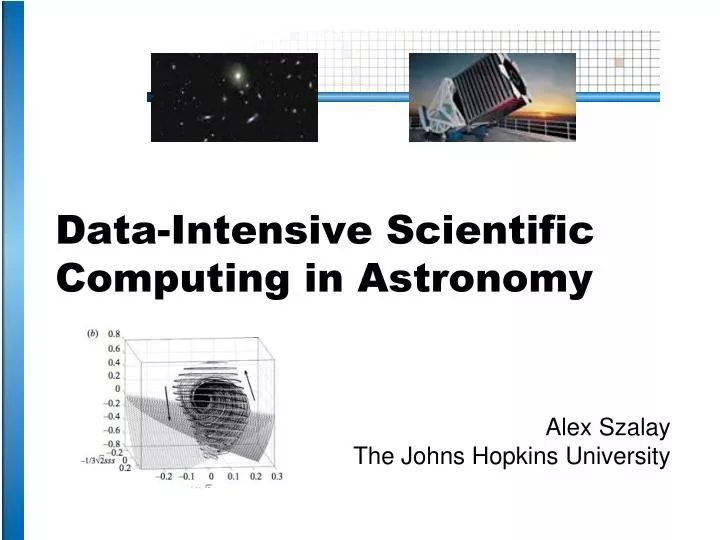
Data-Intensive Scientific Computing in Astronomy Alex Szalay The Johns Hopkins University
Scientific Data Analysis Today • Scientific data is doubling every year, reaching PBs • Data is everywhere, never will be at a single location • Need randomized, incremental algorithms • Best result in 1 min, 1 hour, 1 day, 1 week • Architectures increasingly CPU-heavy, IO-poor • Data-intensive scalable architectures needed • Most scientific data analysis done on small to midsize BeoWulf clusters, from faculty startup • Universities hitting the “power wall” • Soon we cannot even store the incoming data stream • Not scalable, not maintainable…
Building Scientific Databases • 10 years ago we set out to explore how to cope with the data explosion (with Jim Gray) • Started in astronomy, with the Sloan Digital Sky Survey • Expanded into other areas, while exploring what can be transferred • During this time data sets grew from 100GB to 100TB • Interactions with every step of the scientific process • Data collection, data cleaning, data archiving, data organization, data publishing, mirroring, data distribution, data curation…
Why Is Astronomy Special? • Especially attractive for the wide public • Community is not very large • It is real and well documented • High-dimensional (with confidence intervals) • Spatial, temporal • Diverse and distributed • Many different instruments from many different places and times • The questions are interesting • There is a lot of it (soon petabytes) WORTHLESS! • It has no commercial value • No privacy concerns, freely share results with others • Great for experimenting with algorithms
Sloan Digital Sky Survey The University of Chicago Princeton University The Johns Hopkins University The University of Washington New Mexico State University Fermi National Accelerator Laboratory US Naval Observatory The Japanese Participation Group The Institute for Advanced Study Max Planck Inst, Heidelberg Sloan Foundation, NSF, DOE, NASA • “The Cosmic Genome Project” • Two surveys in one • Photometric survey in 5 bands • Spectroscopic redshift survey • Data is public • 2.5 Terapixels of images • 40 TB of raw data => 120TB processed • 5 TB catalogs => 35TB in the end • Started in 1992, finished in 2008 • Database and spectrograph built at JHU (SkyServer)
SDSS Now Finished! • As of May 15, 2008 SDSS is officially complete • Final data release (DR7): Oct 31, 2008 • Final archiving of the data in progress • Paper archive at U. Chicago Library • Deep Digital Archive at JHU Library • CAS Mirrors at FNAL+JHU P&A • Archive contains >120TB • All raw data • All processed/calibrated data • All versions of the database (>35TB) • Full email archive and technical drawings • Full software code repository • Telescope sensor stream, IR fisheye camera, etc
SDSS 2.4m 0.12Gpixel LSST 8.4m 3.2Gpixel PanSTARRS 1.8m 1.4Gpixel
Survey Trends T.Tyson (2010)
Continuing Growth How long does the data growth continue? • High end always linear • Exponential comes from technology + economics • rapidly changing generations • like CCD’s replacing plates, and become ever cheaper • How many generations of instruments are left? • Are there new growth areas emerging? • Software is becoming a new kind of instrument • Value added federated data sets • Large and complex simulations • Hierarchical data replication
Cosmological Simulations Cosmological simulations have 109 particles and produce over 30TB of data (Millennium) • Build up dark matter halos • Track merging history of halos • Use it to assign star formation history • Combination with spectral synthesis • Realistic distribution of galaxy types • Hard to analyze the data afterwards -> need DB • What is the best way to compare to real data? • Next generation of simulations with 1012 particlesand 500TB of output are under way (Exascale-Sky)
Immersive Turbulence • Understand the nature of turbulence • Consecutive snapshots of a 1,0243 simulation of turbulence:now 30 Terabytes • Treat it as an experiment, observethe database! • Throw test particles (sensors) in from your laptop, immerse into the simulation,like in the movie Twister • New paradigm for analyzing HPC simulations! with C. Meneveau, S. Chen (Mech. E), G. Eyink (Applied Math), R. Burns (CS)
Sample Applications Experimentalists testing PIV-based pressure-gradient measurement (X. Liu & Katz, 61 APS-DFD meeting, November 2008) Measuring velocity gradient using a new set of 3 invariants Luethi, Holzner & Tsinober, J. Fluid Mechanics 641, pp. 497-507 (2010) Lagrangian time correlation in turbulence Yu & Meneveau Phys. Rev. Lett. 104, 084502 (2010)
Commonalities • Huge amounts of data, aggregates needed • But also need to keep raw data • Need for parallelism • Use patterns enormously benefit from indexing • Rapidly extract small subsets of large data sets • Geospatial everywhere • Compute aggregates • Fast sequential read performance is critical!!! • But, in the end everything goes…. search for the unknown!! • Data will never be in one place • Newest (and biggest) data are live, changing daily • Fits DB quite well, but no need for transactions • Design pattern: class libraries wrapped in SQL UDF • Take analysis to the data!!
Astro-Statistical Challenges • The crossmatch problem (multi-, time domain) • The distance problem, photometric redshifts • Spatial correlations (auto, cross, higher order) • Outlier detection in many dimensions • Statistical errors vssystematics • Comparing observations to models • ….. • The unknown unknown • Scalability!!!
The Cross Match • Match objects in catalog A to catalog B • Cardinalities soon in the billions • How to estimate and include priors? • How to deal with moving objects? • How to come up with fast, parallel algorithms? • How to create tuples among many surveys andavoid a combinatorial explosion? • Was an ad-hoc, heuristic process for a long time…
The Cross Matching Problem • The Bayes factor • H: all observations of the same object • K: might be from separate objects Astrometry On the sky Budavari & Szalay 2009
Photometric Redshifts • Normally, distances from Hubble’s Law • Measure the Doppler shift of spectral lines • distance! • But spectroscopy is very expensive • SDSS: 640 spectra in 45 minutes vs. 300K 5 color images • Future big surveys will have no spectra • LSST, Pan-STARRS • Billions of galaxies • Idea: • Multicolor images are like a crude spectrograph • Statistical estimation of the redshifts/distances
Photometric Redshifts • Phenomenological (PolyFit, ANNz, kNN, RF) • Simple, quite accurate, fairly robust • Little physical insight, difficult to extrapolate, Malmquist • Template-based (KL, HyperZ…) • Simple, physical model • Calibrations, templates, issues with accuracy • Hybrid (‘base learner’) • Physical basis, adaptive • Complicated, compute intensive • Important for next generation surveys! • We must understand the errors! • Most errors systematic… • Lessons from Netflix challenge…
Cyberbricks • 36-node Amdahl cluster using 1200W total • Zotac Atom/ION motherboards • 4GB of memory, N330 dual core Atom, 16 GPU cores • Aggregate disk space 43.6TB • 63 x 120GB SSD = 7.7 TB • 27x 1TB Samsung F1 = 27.0 TB • 18x.5TB Samsung M1= 9.0 TB • Blazing I/O Performance: 18GB/s • Amdahl number = 1 for under $30K • Using the GPUs for data mining: • 6.4B multidimensional regressions (photo-z)in 5 minutes over 1.2TB • Ported RF module from R in C#/CUDA
The Impact of GPUs • Reconsider the N logN only approach • Once we can run 100K threads, maybe running SIMD N2 on smaller partitions is also acceptable • Recent JHU effort on integratingCUDA with SQL Server, usingSQL UDF • Galaxy spatial correlations: 600 trillion galaxy pairs usingbrute force N2 algorithm • Faster than the tree codes! Tian, Budavari, Neyrinck, Szalay 2010 BAO
The Hard Problems • Outlier detection, extreme value distributions • Comparing observations to models • The unknown unknown… • In 10 years catalogs in the billions, raw data 100PB+ • Many epochs, many colors, many instruments… SCALABILITY!!!
DISC Needs Today • Disk space, disk space, disk space!!!! • Current problems not on Google scale yet: • 10-30TB easy, 100TB doable, 300TB really hard • For detailed analysis we need to park data for several months • Sequential IO bandwidth • If not sequential for large data set, we cannot do it • How do can move 100TB within a University? • 1Gbps 10 days • 10 Gbps 1 day (but need to share backbone) • 100 lbs box few hours • From outside? • Dedicated 10Gbps or FedEx
Tradeoffs Today Stu Feldman: Extreme computing is about tradeoffs Ordered priorities for data-intensive scientific computing • Total storage (-> low redundancy) • Cost (-> total cost vs price of raw disks) • Sequential IO (-> locally attached disks, fast ctrl) • Fast stream processing (->GPUs inside server) • Low power (-> slow normal CPUs, lots of disks/mobo) The order will be different in a few years...and scalability may appear as well
Cost of a Petabyte From backblaze.comAug 2009
JHU Data-Scope • Funded by NSF MRI to build a new ‘instrument’ to look at data • Goal: 102 servers for $1M + about $200K switches+racks • Two-tier: performance (P) and storage (S) • Large (5PB) + cheap + fast (400+GBps), but …. ..a special purpose instrument
Proposed Projects at JHU 19 projects total proposed for the Data-Scope, more coming, data lifetimes between 3 mo and 3 yrs
Fractal Vision • The Data-Scope created a lot of excitement but also a lot of fear at JHU… • Pro: Solve problems that exceed group scale, collaborate • Con: Are we back to centralized research computing? • Clear impedance mismatch between monolithic large systems and individual users • e-Science needs different tradeoffs from eCommerce • Larger systems are more efficient • Smaller systems have more agility • How to make it all play nicely together?
Increased Diversification One shoe does not fit all! • Diversity grows naturally, no matter what • Evolutionary pressures help • Large floating point calculations move to GPUs • Large data moves into the cloud • RandomIOmoves to Solid State Disks • Stream processing emerging (SKA…) • noSQLvs databases vs column store vsSciDB … • Individual groups want subtle specializations At the same time • What remains in the middle (common denominator)? • Boutique systems dead, commodity rules • Large graph problems still hard to do (XMT or Pregel)
Embracing Change • When do people switch tools? • When current tools are inadequate • When new tools have significant new properties • Gains must overcome the cost of switching • When do people switch laptops? • Substantially faster (x3) • Substantially lighter (x1/2) • Substantially new features (easier to use) • Peer pressure (my friends are switching…) • As boundary conditions change, need to modify our approach every year • Dampen the impact of these changes to the community
Summary • Large data sets are here, solutions are not • 100TB is the current practical limit • Science community starving for storage and IO • No real data-intensive computing facilities available • Changing with Dash, Gordon, Data-Scope, GrayWulf… • Even HPC projects choking on IO • Real multi-PB solutions are needed NOW! • Cloud hosting currently very expensive • Cloud computing tradeoffs different from science needs • Scientists are “frugal”, also pushing the limit • Current architectures cannot scale much further • Astronomy representative for science data challenges
“If I had asked my customers what they wanted, they would have said faster horses…” Henry Ford From a recent book by Eric Haseltine:“Long Fuse and Big Bang”