Download
1 / 36
360 likes | 533 Views
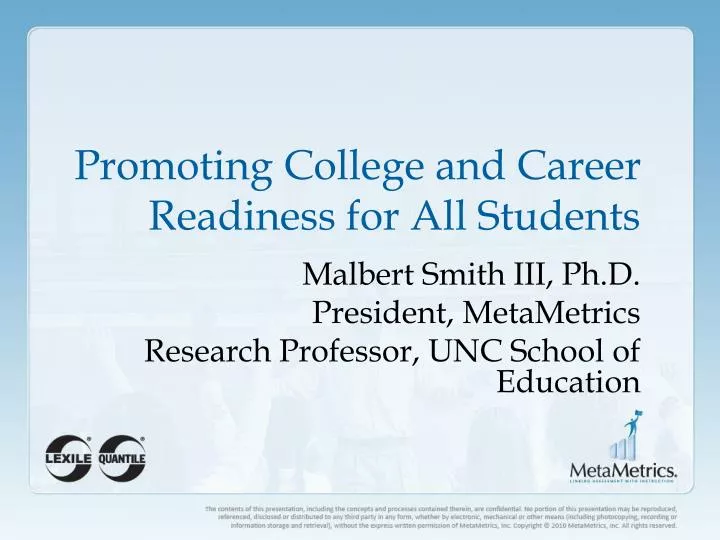
Promoting College and Career Readiness for All Students. Malbert Smith III, Ph.D. President, MetaMetrics Research Professor, UNC School of Education. Agenda. The Goal The Problem Bridging the Readiness Gap Bending the Curve: Eliminating Summer Loss.

E N D
Promoting College and Career Readiness for All Students Malbert Smith III, Ph.D. President, MetaMetrics Research Professor, UNC School of Education
Agenda • The Goal • The Problem • Bridging the Readiness Gap • Bending the Curve: Eliminating Summer Loss
“If we can dramatically increase high school graduation rates, if we can dramatically increase the number of graduates who are college and career ready, that’s what this is about. Everything’s a means to that end. That’s the Holy Grail here. Are our students being prepared to be successful?” – Arne Duncan Education Week, December 9, 2009.
Quick Facts • Each year, approximately 1.2 million students fail to graduate from high school, more than half of whom are from minority groups. • Percent of freshmen that enroll in at least one remedial course Alliance for Excellent Education, February 2009 edition.
Students Obtaining Bachelor’s Degree in Eight Years Students who enroll in a remedial reading course are 41 percent more likely to drop out of college. (NCES, 2004a) Alliance for Excellent Education, February 2009 edition.
“High school completion does not equal college readiness.” – Education Week • Gewertz, Catherine. “College-Readiness Program Hard to Gauge." Education Week 30.18 (2011): 1+. Print
Common Core Standards for English Language Arts and Literacy in History/Social Studies & ScienceAppendix A: Findings • Students who fall short of ACT's college readiness benchmarks have the greatest difficulty with the test items involving the most complex text. • K-12 reading assignments have become much less demanding in the last half-century, with an especially large drop-off in high school expectations. Weston, S. P. (2010). “The giant text complexity challenge inside the new literacy standards.” The Prichard Committee for Academic Excellence
Common Core Standards for English Language Arts and Literacy in History/Social Studies & ScienceAppendix A: Findings • College reading assignments have moved in the opposite direction, becoming a bit harder over the same fifty years. • High school teachers commonly give students many kinds of support and coaching to help them figure out the material, but college teachers expect students to pull the knowledge from the text on their own, making the gap in practical ability even wider than the gap in the texts themselves.
Common Core Standards • The Lexile measure helps determine • What text is appropriate for each grade band. • What is “stretch text?”
Ensuring Students Are College and Career Ready • Mitigate summer loss • Increase the diet of non-fiction text • Utilize instructional tools and resources that promote differentiated instruction and deliberate practice
Estimated Cumulative Differences in Language Experience by 4 Years of Age Professional Family 50_ 40_ Working-Class Family Estimated Cumulative Words Addressed to Child (in millions) 30_ 20_ Welfare Family 10_ 12 24 36 48 Age of Child in Months
Mitigate Summer Learning Loss Fairchild, R. McLaughlin, B. & Brady, J. (2006). Making the Most of Summer: A Handbook on Effective Summer Programming and Thematic Learning. Baltimore, MD: Center for Summer Learning.
Mitigate Summer Learning Loss • Cumulative Effect of Summer Loss • Summer Loss Research by Dr. James Kim • “Find a Book”
Effects of a Voluntary Summer Reading Intervention on Reading Achievement Results From a Randomized Field Trial Key Points Eight books at: • Interest Category • Lexile Level Kim, J.S. (2005). Project READS (Reading Enhances Achievement During Summer): Results from a Randomized Field Trial of a Voluntary Summer Reading Intervention.
“Find a Book” Search for books by Lexile measure, title, author, ISBN, or keyword.
“Find a Book” Search for books by Lexile measure, title, author, ISBN, or keyword. Students who do not have a Lexile measure can use a quick and simple utility within “Find a Book” to estimate their Lexile range.
“Find a Book” Search for books by Lexile measure, title, author, ISBN, or keyword.
Increase the Diet of Non-Fiction Text • Duke, Nell K. “The Real-World Reading and Writing U.S. Children Need.” Phi Delta Kappan 91, no. 5 (February 2010): 68-71. • PIRLS 2001 International Report: IEA’s Study of Reading Literacy Achievement in Primary Schools, Mullis, I.V.S., Martin, M.O., Gonzalez, E.J., & Kennedy, A.M. (2003), Chestnut Hill, MA: Boston College.
Percentage distribution of literary and informational passages National Assessment Governing Board. Reading Framework for the 2009 National Assessment of Educational Progress. Washington, D.C.: American Institutes for Research, 2007.
How can we do better? Anderson et al., 1988, Table 3, N=155
Estimating the Impact of Family and Home on Student Achievement • Single-Parent Families • Parents Reading to Children Every Day • Hours Spent Watching Television • Frequency of School Absences Educational Testing Service (www.ets.org)
Percentage of Children in Single-Parent Families, by State, 2004 Courtesy of: Educational Testing Service (www.ets.org) * All states were listed. A sample of states were taken for this slide.
Percentage of Children Who Were Read to Every Day in the Past Week, 2003 Courtesy of: Educational Testing Service (www.ets.org) * All states were listed. A sample of states were taken for this slide.
Percentage of Eighth-Graders Watching Four or More Hours of Television per School Day, 2000 Courtesy of: Educational Testing Service (www.ets.org) * All states that took the NAEP were listed. A sample of states were taken for this slide.
Percentage of Eight-Graders Who Are Absent Three Days of More per Month, by State, 2005 Courtesy of: Educational Testing Service (www.ets.org) * All states were listed. A sample of states were taken for this slide.
Parent-Teacher Meetings, School Websites, School Bulletins, etc. • Emphasize the Importance of: • Attendance • Restricting TV • Reading / Writing at home
Courtesy of: http://picayune.uclick.com/comics/ch/1992/ch920330.gif
Contact Info: Malbert Smith III, Ph.D.President, MetaMetrics Research Professor, UNC School of Education msmith@Lexile.com