Download
1 / 53
530 likes | 765 Views
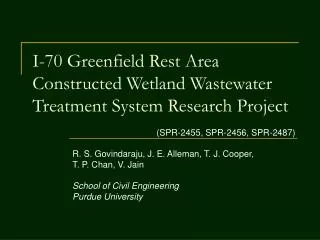
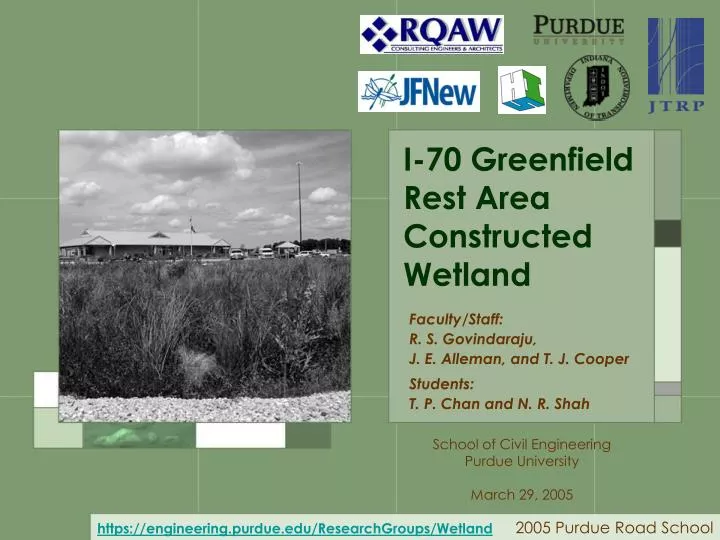
I-70 Greenfield Rest Area Constructed Wetland. Faculty/Staff: R. S. Govindaraju, J. E. Alleman, and T. J. Cooper Students: T. P. Chan and N. R. Shah . School of Civil Engineering Purdue University March 29, 2005. https://engineering.purdue.edu/ResearchGroups/Wetland. Project Involvement.

E N D
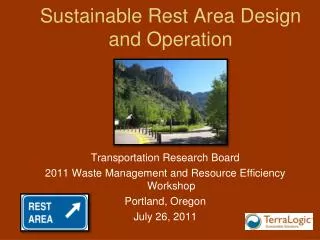
I-70 Greenfield Rest AreaConstructed Wetland Faculty/Staff:R. S. Govindaraju, J. E. Alleman, and T. J. Cooper Students:T. P. Chan and N. R. Shah School of Civil Engineering Purdue University March 29, 2005 https://engineering.purdue.edu/ResearchGroups/Wetland
Project Involvement INDOT: Financial support & technical guidance JTRP & Purdue: Research sponsorship ‘Hydraulic’ project: to track and evaluate flow rates and fate ‘Environmental’ project: to track wastewater treatment efficacy J.F. New: Sub-contracted design engineering for wetlands Indiana Department of Health: Wetland discharge permitting RQAW: Design engineering Heritage: Project construction
Wastewater Treatment Clean Water Waste ?
o o o Basic Lagoon Clean Water Waste • Very simple!
o Clean Water Waste o o Basic Lagoon O2 O2 O2 O2 O2 O2 O2 • Very simple! • However, mixing depends on wind! • Therefore, sometimes poorly mixed • Poor mixing means poor aeration • Oxygen supply will then be poor • Lagoon may stink!!
o Clean Water Waste o o Aerated Lagoon O2 O2 • Improved aeration • Better oxygen supply • Better biological kinetics • Smaller lagoon
Aerated Lagoon Floating Mechanical Aerator
o Clean Water Waste o o Aerated Lagoon ? O2 O2 • Improved aeration • Better oxygen supply • Better biological kinetics • Smaller lagoon • However, not very attractive… • and windborne disease issues
Constructed Wetland (CW) Clean Water Waste
Characteristics Clean Water Waste • Constructed Wetland • Wetland plants tolerate routine submergence • High plant density • High plant root mass • High rate plant root release of oxygen • High bacterial growth on plant root surfaces • High biochemical degradation of waste
How Does it Work? Enhanced?Biometabolism Clean Water Waste
O2 Media Media Media O2 O2 O2 Plant Root O2 O2 Media Media O2 O2 Plant Root O2 O2 O2 O2 Plant Root O2 O2 Media O2 Media Media O2 O2 Media O2
Media Media Media Plant Root • Constructed Wetland • Plants release oxygen via photosynthetic activity • High microbial activity on, and adjacent, to plant roots • However, oxygen may still be a critical limiting factor Media Media Plant Root Plant Root Media Media Media Media
Extensive bacterial Colonization of root tip surface area!
How to Increase DO? • Direct aeration • Rapid changes in water level • Expose thin water films and biofilms on the wetland substrate and plant roots to air • Large surface area rapid and substantial oxygenation of the rhizosphere. • Greenfield rest area • Fill-and-Draw concept
Fill-and-Draw CW 'Draw' O2 Concept developed by J.F. New!! Our facility is one of first in the US to use this strategy!! Clean Water Waste
Fill-and-Draw CW 'Fill' Clean Water Waste
Fill-and-Draw CW 'Draw' O2 Clean Water Waste
Challenges at Rest Areas • Remote location • Rural locale • Away from existing sewer and POTW • High wastewater strength • Low-flush toilets • High variability in wastewater flow • Large increase in traffic volume during rush hours and holidays • Limited personnel
Project Overview • Unique challenges • Long (3+ miles) sewer line to the city POTW • Low flush toilets; flow restrictive faucets • High strength wastes (BOD, Ammonia) • Odor problem at city lift station • Surcharges by the city • Pretreatment using constructed subsurface wetlands • Biofield (and city sewer) for effluent disposal
Why Wetlands? • Conventional technologies • Pros: proven technologies • Cons: high capital and maintenance costs • Subsurface constructed wetlands • Pros: • Low maintenance • Aesthetic / positive public perception • Cons: • Large footprint • Lack of supporting data
Design Parameters • Design flow rate: 10,000 gpd • Wastewater characteristics: • BOD5 ~ 450 mg/L • NH3-N ~ 150 mg/L • TSS ~ 180 mg/L
Wetland Cells 1 & 2 Vegetated subsurface flow wetland Vertical filter
First Year in Operation • Wetland cells planted on August 12, 2003 • October 2003 – June 2004 • Startup period • Overflow mode • North side only • Mid June 2004 – present • Draw-and-fill mode (time-based) • Full Operation beginning in October
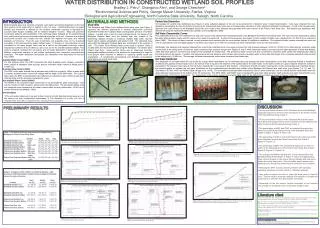
Daily Rainfall and Flow Totals Tailing response to rainfall - Daily Cycle - Weekly Cycle - Seasonal Cycle
Flow Data • Variability in flow • Daily Cycle • Weekly Cycle • Monthly Cycle • Extreme events: • High traffic volume during holidays • Rainfall • > 2-fold increase in daily flow • Effects of ET and rainfall • 1 mm ET / rainfall 300 gal decrease / increase in flow volume
D Outflow from Cells 1 & 2 No overflow Overflow at filling cell Draw-and-fill mode: 12-hour cycle during Saturday – Monday 24-hours cycle during Tuesday – Friday
Dynamic Modeling • Complex flow scheme • Changing water levels • Recirculation • Overflows • Simplifying assumptions • Treat wetland cells as giant buckets • Instantaneous overflow • Estimate HRT • Basis for design of similar systems
Hydraulic Retention Time *The value in parenthesis is the estimated HRT as if in the over-flow mode.
Wetland Performance • - Definite pattern of increased performance… • Obvious correlation with increased plant and root density • However, lagging ammonia removal problem!! • Strong suggestion that oxygen is limited! TSS % Removal BOD NH3 Days of Operation
Wetland Performance • Ponding • Lack of air-filled layer between water table and peat moss layer • Limited root growth • Invasive plant species • Overflows during the fill cycle • Short-circuiting
Continuing/Future Activities • Continuing data collection and analysis • “Tweaking” the system for optimum treatment effectiveness • Additional of a surge tank • Development of hydraulic and treatment process model • Modifying existing wetland design guidelines, tailored to rest area application