Download
1 / 1
10 likes | 76 Views
RF MEASUREMENT AND CONTROL Luke Nemuras Richard Ooi. 5. Circuit Schematic:. Fig 1: Paschen Diagram. 6. Dynamic Feedback. 3. Project Goals:.

E N D
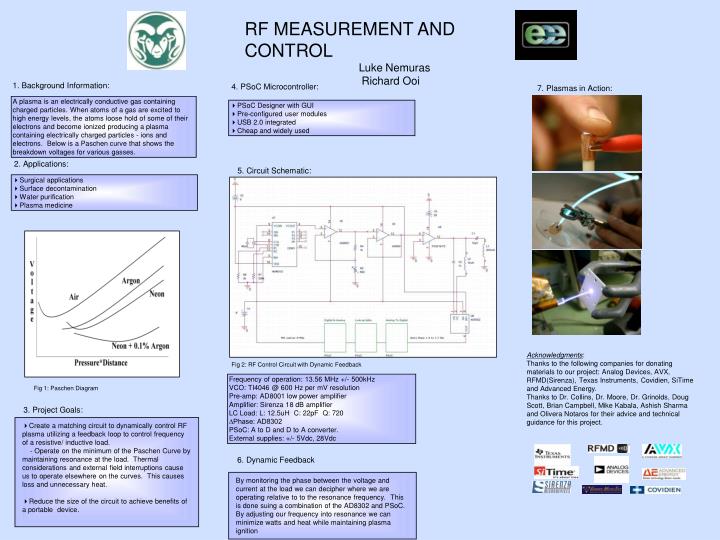
RF MEASUREMENT AND CONTROL Luke Nemuras Richard Ooi 5. Circuit Schematic: Fig 1: Paschen Diagram 6. Dynamic Feedback 3. Project Goals: Create a matching circuit to dynamically control RF plasma utilizing a feedback loop to control frequency of a resistive/ inductive load. - Operate on the minimum of the Paschen Curve by maintaining resonance at the load. Thermal considerations and external field interruptions cause us to operate elsewhere on the curves. This causes loss and unnecessary heat. Reduce the size of the circuit to achieve benefits of a portable device. By monitoring the phase between the voltage and current at the load we can decipher where we are operating relative to to the resonance frequency. This is done suing a combination of the AD8302 and PSoC. By adjusting our frequency into resonance we can minimize watts and heat while maintaining plasma ignition 1. Background Information: 4. PSoC Microcontroller: A plasma is an electrically conductive gas containing charged particles. When atoms of a gas are excited to high energy levels, the atoms loose hold of some of their electrons and become ionized producing a plasma containing electrically charged particles - ions and electrons. Below is a Paschen curve that shows the breakdown voltages for various gasses. • PSoC Designer with GUI • Pre-configured user modules • USB 2.0 integrated • Cheap and widely used 2. Applications: • Surgical applications • Surface decontamination • Water purification • Plasma medicine Acknowledgments: Thanks to the following companies for donating materials to our project: Analog Devices, AVX, RFMD(Sirenza), Texas Instruments, Covidien, SiTime and Advanced Energy. Thanks to Dr. Collins, Dr. Moore, Dr. Grinolds, Doug Scott, Brian Campbell, Mike Kabala, Ashish Sharma and Olivera Notaros for their advice and technical guidance for this project. Fig 2: RF Control Circuit with Dynamic Feedback 7. Plasmas in Action: Frequency of operation: 13.56 MHz +/- 500kHz VCO: TI4046 @ 600 Hz per mV resolution Pre-amp: AD8001 low power amplifier Amplifier: Sirenza 18 dB amplifier LC Load: L: 12.5uH C: 22pF Q: 720 ∆Phase: AD8302 PSoC: A to D and D to A converter. External supplies: +/- 5Vdc, 28Vdc